Environmental Engineering Reference
In-Depth Information
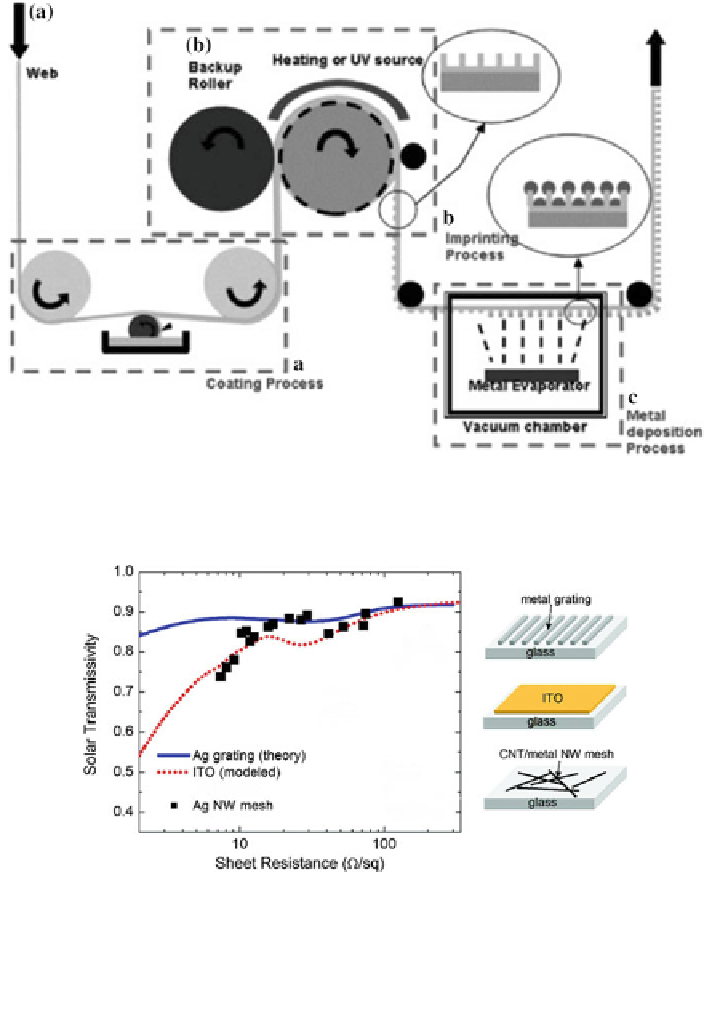
Fig. 10 Schematic of the roll-to-roll nanoimprinting process for preparation of metal nanogrids.
2013 John Wiley and Sons. Reprinted, with permission from Ref. [
25
]
Fig. 11 Solar photon flux-weighted transmissivity versus sheet resistance: Ag gratings (blue
line), data is collected from finite element modeling with grating period is 400 nm, the Ag line
width is 40 nm, and varying thickness to achieve different sheet resistance; ITO (red dotted line),
the data are computed based on optical constants for e-beam-deposited ITO acquired using
spectroscopic ellipsometry; Ag nanowire (black square),the data are obtained experimentally.
2013 American Chemical Society. Adapted, with permission from Ref. [
27
]
The percolation theory predicts that for a random network of conducting sticks,
the percolation threshold dramatically decreases as the length of sticks increases as
given in Eq. (
4
)[
28
]. Therefore, longer and thinner AgNWs are preferable for

Search WWH ::

Custom Search