Information Technology Reference
In-Depth Information
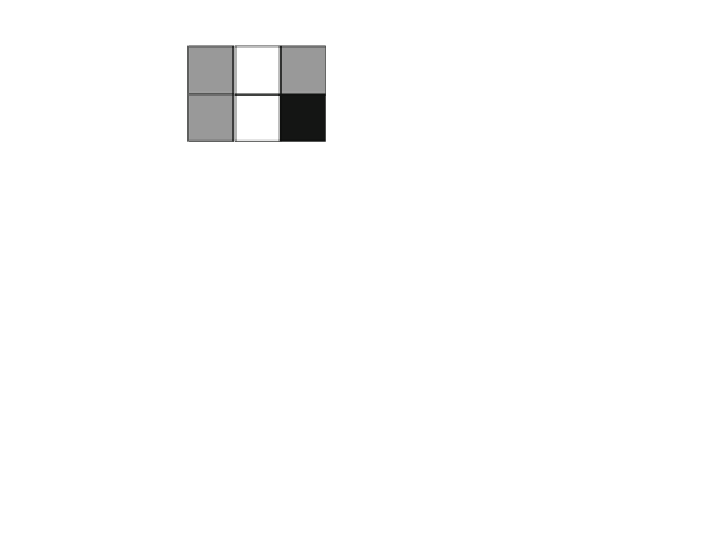
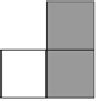
a(i,j)
Fig. 6.2
Reconstruction process in the 2D step
Step 5:
Repetition of the Steps 3 and 4 until desired level is reached. In the
research, experiments were made to find maximum number of repetition
for standard wavelets.
Step 6:
Output of the algorithm is the coefficients' vector. The vector is saved in
storage. Media for saving data can be magnetic or optical.
Two questions are of importance when the vector is storage. The first one is
medical value of the stored data. The second one is how to use it. As stated
previously, medical experts confirmed medical value of data obtained by algo-
rithm. But, to be able to see the images, first images have to be reconstructed from
coefficients' vector. Medical experts cannot evaluate coefficients, but images. So,
the second part of the proposed system is the algorithm for visualization of the
compressed data.
Algorithm for visualization of the compressed data involves reconstruction and
interpolation of coefficients. The proposed reconstruction procedure is illustrated
in Fig.
6.2
. The proposed algorithm is shown in Fig.
6.3
.
Step 1. Input to the algorithm is vector of coefficients stored in previous phase.
This phase is activated when request for visualization occur.
Step 2. Input vector is upsampled by introducing zeros. This is performed col-
umnwise, which means that number of columns is approximately doubled.


Search WWH ::

Custom Search