Environmental Engineering Reference
In-Depth Information
6.0
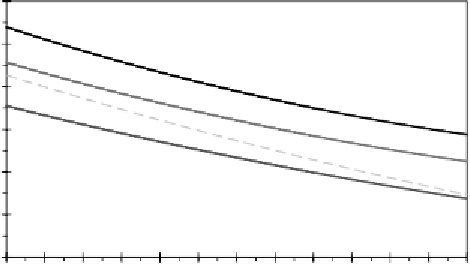
slug flow
solid curves for m
S
= 30 kg h
-1
+ m
V
/2
dashed curves m
S
= 50 kg h
-1
+ m
V
/2
5.0
4.0
m
v
= 8 kg h
-1
3.0
m
v
= 6 kg
h
-1
2.0
bubbly flow
m
v
= 4 kg h
-1
1.0
0.0
90
95
100
105
110
115
120
125
130
135
140
145
150
Mean internal generator temperature T
G
/ °C
Figure 5.53
Transition from slug to bubbly flow as a function of mean generator temperature for
different tube diameters
Asimple expression given byNarayankhedkar andMaiya (1985) relates the required
minimum height difference
Y
between the rich solution level in the reservoir and the
level of the heating zone at which the bubbles are formed in the bubble pump for
the circulation. The derivation of the minimum height difference equation with the
coefficients
K
1
and
K
2
is described in Chen
et al
., (1996). The minimum height
difference increases with the bubble pump lifting height
h
and decreases with the
mean generator boiling temperature
T
b
. The analysis is based on the assumptions that
all bubbles are formed at the bottom of the minimum height difference, that there is no
relative velocity between the weak solution and the refrigerant vapour bubbles in the
tube, and the friction loss and vapour pressure of the absorbent water are negligible:
ph
Y
=
ρ
Sr
K
1
p
K
2
10
3
(5.11)
+
−
p
where
1
−
X
Sr
K
1
=
(1
−
X
Sw
)
ρ
Sw
(
X
Sr
−
X
Sw
)
RT
b
(1
K
2
=
−
X
Sw
)
M
NH
3
For a relative molecular mass
M
NH
3
of the refrigerant ammonia of 17 kg kmol
−
1
and the given data in Table 5.6 for mean boiling temperatures, rich and weak solu-
tion concentrations and densities, total pressures and the two different lifting heights,


Search WWH ::

Custom Search