Environmental Engineering Reference
In-Depth Information
80
70
60
50
40
30
20
10
10:00
11:00
12:00
13:00
Time on 19 September
exterior (HfT)
supply 01 (HfT)
supply 02 (HfT)
supply 03 (HfT)
supply 04 (HfT)
supply (Sauter)
exterior (Sauter)
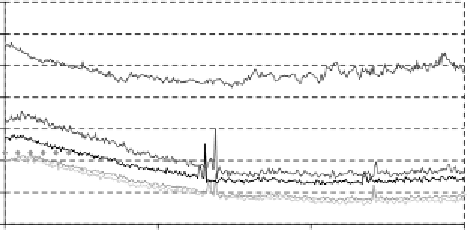
Figure 5.22
Relative humidity measurements on the sorption wheel in Mataro
The temperature after the drying process is highest on the sidewhere the dry sorption
material enters the process air stream and adsorbs most of the moisture. Here the tem-
perature level is up to 8 K higher than at the other end of the sorption wheel, where the
humidity has been adsorbed during the rotation half period. The averaged temperature
signals deviate by 1-2 K from the building management sensor. In the measurement
interval the solar supplied regeneration air temperatures steadily increased from 51
◦
C
at 10:00 to 62
◦
C at 13:00.
The relative humidity measurements as recorded by the building management sys-
tem show a stepwise change for every 5% change in humidity (see Figure 5.22). This
is purely due to the recording strategy of the building management system and should
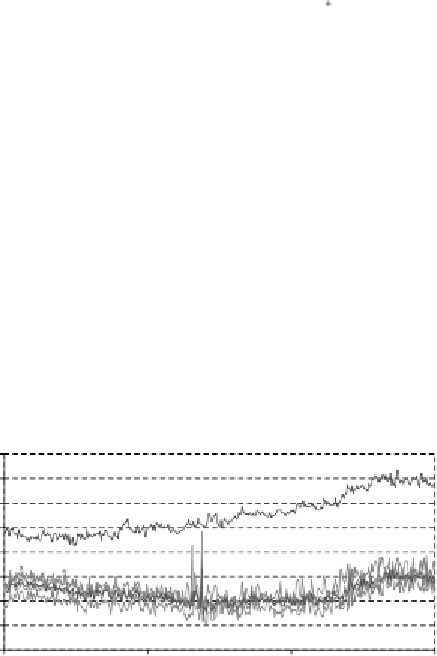
be adjusted if detailed results are needed. The combination of errors in temperature
measurement and imprecise humidity measurements lead to strong deviations of up
to1gkg
−
1
when the absolute humidities are calculated (see Figure 5.23).
16
15
14
13
12
11
10
9
8
10:00
11:00
12:00
13:00
Time on 19 September
exterior (Hft)
supply 01 (HfT)
supply 02 (HfT)
supply 03 (HfT)
supply 04 (HfT)
supply average (HfT)
supply (Sauter)
exterior (Sauter)
Figure 5.23
Absolute humidities calculated from measured relative humidities and temperatures


Search WWH ::

Custom Search