Environmental Engineering Reference
In-Depth Information
8.0
7.0
6.0
5.0
4.0
3.0
2.0
1.0
0.0
30.0
50.0
70.0
90.0
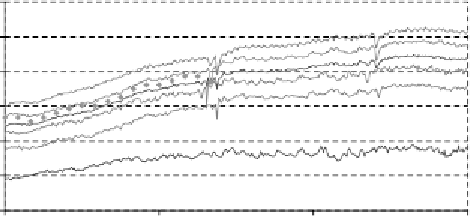
Regeneration temperature
Figure 5.20
Dehumidification of the process air measured during the commissioning procedure
If the dehumidification rate is sufficient at such low regeneration temperatures, this
low-temperature regeneration mode is preferable in terms of energy efficiency.
The dehumidification rates obtained from measured temperature levels and relative
humidities rise with increasing regeneration temperature, but fluctuate strongly (see
Figure 5.20).
To determine the cause of the fluctuations in absolute humidity change, more
detailed measurements were done on the 2.1m diameter wheel. Four temperature
and humidity sensors (type ebro EBI-2TH-611) were placed in the process air stream
behind the sorption wheel for a detailed comparison with the averaging temperature
sensor and single point humidity sensor, which are connected to the building manage-
ment system (from the Sauter company). The single point temperature measurements
of the exterior air before the sorption wheel correspond very well (Figure 5.21).
50
45
40
35
30
25
20
10:00
11:00
12:00
13:00
Time on 19 September
exterior (HfT)
supply 01 (HfT)
supply 02 (HfT)
supply 03 (HfT)
supply 04 (HfT)
supply average (HfT)
supply (Sauter)
exterior (Sauter)
Figure 5.21
Temperature levels before and after the sorption wheel with one building management
system sensor and four distributed sensors. The sensors were provided either by the building management
company Sauter or by the University of Applied Sciences in Stuttgart


Search WWH ::

Custom Search