Environmental Engineering Reference
In-Depth Information
25
Soil measured
Soil simulated
20
15
10
5
0
0
4000
8000
12
000
16
000
20
000
24
000
Hours after 1 January 2001
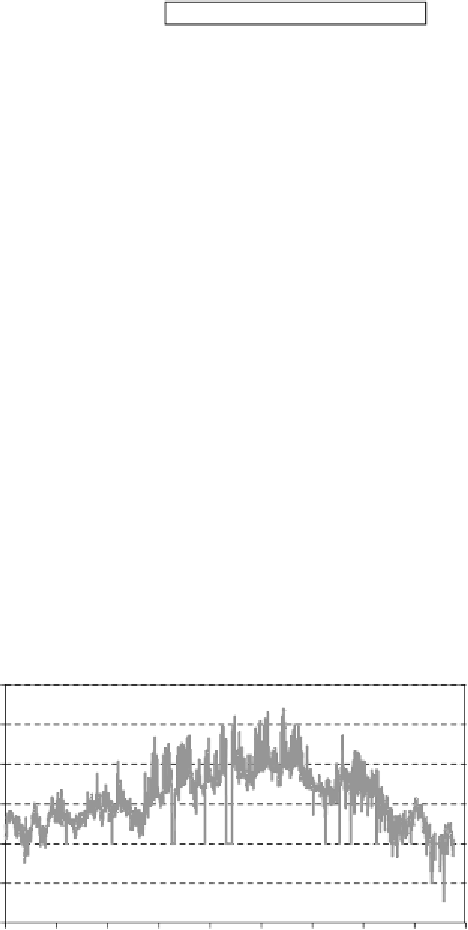
Figure 4.4
Measured and simulated soil temperatures at 2
.
35m depth
unusually warm year of 2003 is found to be very satisfactory (see Figures 4.5, 4.6
and 4.7).
Given the limited input effort and the fast calculation process, even dynamic situ-
ations can be modelled with acceptable results down to a resolution of one hour. The
mean differences between the measured and simulated outlet temperature for the years
of 2001 to 2003 are 0.4, 0.7 and 0
.
4 K respectively (as an example see Figure 4.7).
40
30
20
10
0
-10
-20
0
1000
2000
3000
4000
5000
6000
7000
8000
9000
Hours after 1 January 2001
Input air measured
Output air measured
Simulated - measured
Figure 4.5
Measured ambient and outlet air temperature of the earth heat exchanger in the moderate
year of 2001. Also shown is the temperature difference between the simulated and measured value


Search WWH ::

Custom Search