Environmental Engineering Reference
In-Depth Information
35
30
25
20
15
10
5
0
-5
-10
0
1000
2000
3000
4000
5000
6000
7000
8000
9000
Hours after 1 January 2002
Input air measured
Output air measured
Simulated - measured
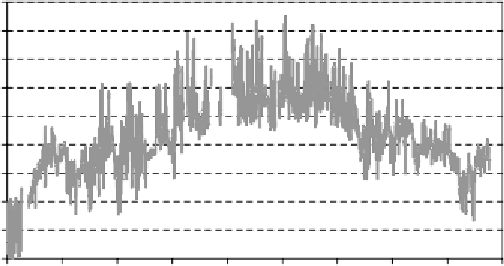
Figure 4.6
Ambient air and outlet air of the earth heat exchanger in the moderate year of 2002. Also
shown is the temperature difference between the simulated and measured value
The cumulative frequency distribution of the exit air temperature shows that the
agreement between simulation and measurement is excellent at low exit temperatures,
that is in winter, and that in summer the simulated temperature is slightly lower than
the measured temperature (results from 2001 in Figure 4.8); 95% of all temperatures
are below 20
◦
C, which shows the good summer cooling potential, and the temperature
is never below 0
◦
C, which is excellent to prevent winter freezing of the heat recovery
unit in the mechanical ventilation system.
50.0
40.0
30.0
20.0
10.0
0.0
-10.0
-20.0
0
1000
2000
3000
4000
5000
6000
7000
8000
9000
Hours after 1 January 2003
Input air measured
Output air measured
Simulated - measured
Figure 4.7
Outlet temperatures of the earth heat exchanger in the warm year of 2003. Also shown is
the temperature difference between the simulated and measured value


Search WWH ::

Custom Search