Image Processing Reference
In-Depth Information
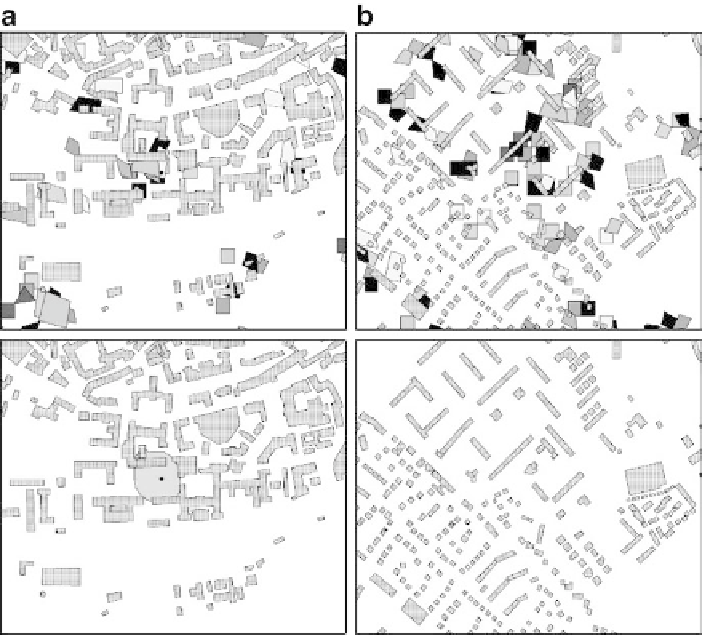
Fig. 11.9
Determination of pseudo-station identical to the measuring station STG Centre 2
BD TOPO© and of the results of the individual classifications achieved for each
date. The measuring station is the spot in the middle of the figure. The gray tones
denote the number of times a particular site appears as a pseudo-station in the
ensemble of classifications. Figure
11.9b
is the same but for another place in the
city with no actual measuring station. Figure
11.9c, d
represent the intersection of
all the classifications taking into account a circle of influence. In Fig.
11.9c
, the
intersection area is the area surrounding the measuring station, showing the normal
behavior of the process. Figure
11.9d
presents a pseudo-station, i.e. an area that has
the same ID card than the measuring station.
From the analysis of the full set of data, 28 pseudo-stations were determined.
A measuring campaign in June 2003, has confirmed the behavior of some of the
pseudo-stations with respect to pollutant concentration. Mobile means for air
pollution measurement have been installed at several of these 28 pseudo-stations.