Chemistry Reference
In-Depth Information
O
O
O
N
N
O
Cu
O
N
N
O
O
O
N
C
S
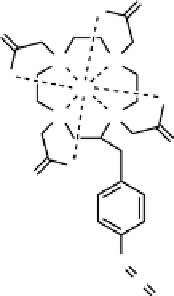
fIGure 16.29
Structure of
p
-NCS-Bn-DOTA -
64
Cu.
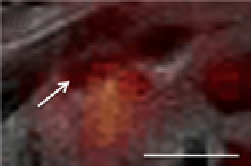
(b)
2D PET/MRI overlay
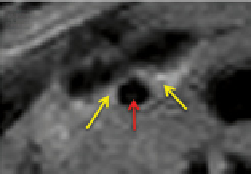
(c)
MRI
(a)
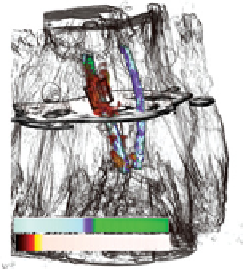
3D PET/MRI overlay
(d)
MRI 3D surface rendring
MRI
PET
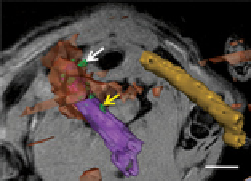
fIGure 16.30
Multimodal macromolecular probes localise to the injured vessel in the rat copper cuff model. (a) Overlay of PET with
MRI 24 h post injection (head at top, out of field of view). The PET and MR signal from vessels was rendered in colour using the assign-
ments shown in the scale bar. The plane through the image indicates the position of the image shown in (b). This co-registered MRI/PET
image shows a diffuse cloud of PET signal in the region around the injured vessel and region of higher MR intensity on the right side of
the vessel. The clavicle is the dark region indicated by the white arrow. Scale bar = 2.5 mm. (c) The MR image from the same plane clearly
shows elevated MR contrast in the walls of the vessel. (d) 3D reconstruction of MRI and PET data in an oblique orientation shows the
discrete accumulations of macrophages on the vessel wall. Scale bar = 5 mm. This view is zoomed out from the FOV in panels (b) and (c)
to include both vessels. Injured carotid artery is purple, increased MR signal intensity relative to vessel background is green, PET signal
is orange, and contralateral vessel is gold. Reproduced with permission from Ref. [8]. (
See insert for colour representation of the figure.)
)