Chemistry Reference
In-Depth Information
reflected by the dichroic mirror and directed by the galvanometer mirrors to a position on the samples. The upconversion
luminescence signals were collected by an objective lens and deflected by the galvanometer mirrors again to the dichroic
mirror. Different from the excitation laser beam, upconversion luminescence signals can transmit through the dichroic mirror
to the spectroscopical system and be detected by a photomultiplier tube (R6357 Enhanced model, HAmAmATSU, Japan).
A filter was placed before the detector to further filter the excitation laser line and select the detection wavelength. A con-
focal pinhole was set behind the dichroic mirror and in front of the filter to improve the resolution in the z-direction. This
in
vitro
upconversion imaging system is known as laser scanning upconversion luminescence microscopy (LSUCLm), which
is ready for the upconversion imaging characterisation of cells and micro-samples.
Li and co-workers also developed an
in vivo
upconversion imaging system. Two 0-10 W output-tunable 980 nm lasers
were introduced to the commercial imaging system (Scheme 13.3b) [3]. optical filters were employed before the detector to
block the excitation laser line and select the desired UCL signals. An electron multiplying charge coupled device (EmCCD,
Andor DU987) was used as the detector. The most used UCL signals for small-animal imaging are located at around 800 nm
from the emission of Tm
3+
to enable large penetrating depth.
13.4.2
experimental Proof Showing the Superiority of upconversion bioimaging
Using the above mentioned imaging instrument, upconversion images were obtained from biosamples to verify this upcon-
version imaging technique.
13.4.2.1 Low Background and High Signal-to-noise Ratio (SnR)
The main noise problem in bioimaging experiments
results from autoluminescence and bioluminescence, widely found in biotissues. These luminescent signals can be excited
by common excitation sources, such as ultraviolet and visible light. Upconversion luminescence uses NIR photons as exci-
tation sources. These photons have low energy, which do not excite the lumino-groups in biotissues, thus the background
luminescent signals can, in theory, be blocked.
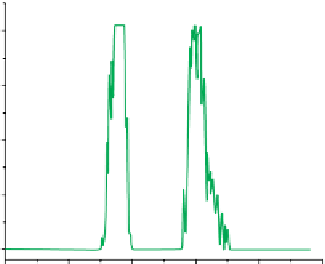
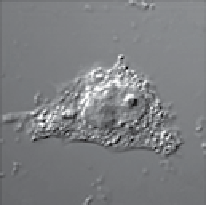
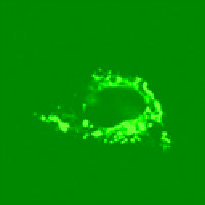
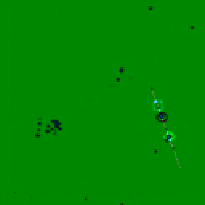
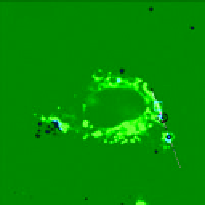
An experimental example has been provided by Li and co-workers (Figure 13.4) [2]. The confocal image of a live HeLa
cell dual-labelled with 1,1'-dioctadecyl-3,3,3',3'-tetramethylindocarbocyanine perchlorate (DiI) and Ln-UCNPs showed no
fluorescence signals from DiI or cell tissues under excitation at 980 nm, while the emission intensity from Ln-UCNPs
exceeded the saturation value of the detection.
(a)
(b)
(e)
2
3
4000
3000
(c)
(d)
2000
1000
1
2
3
1
2
3
1
0
0
5
10
Position (m)
15
20
25
FIgure 13.4
Bright field (a) and luminescent images (b-d) of a live HeLa cell dual-labelled with DiI and UCNPs. (b) Image of
DiI when emission was collected at 560-600 nm (
λ
ex
= 543 nm). (c) UCL image of UCNPs when emission was collected at 500-600 nm
(
λ
ex
= 980 nm). (d) The image of DiI and UCNPs when overlaid. (e) The detected upconversion signals along the line in (c) and (d).
Reprinted with permission from Ref. [2]. Copyright 2009 American Chemical Society. (
See insert for colour representation of the figure.)
)