Environmental Engineering Reference
In-Depth Information
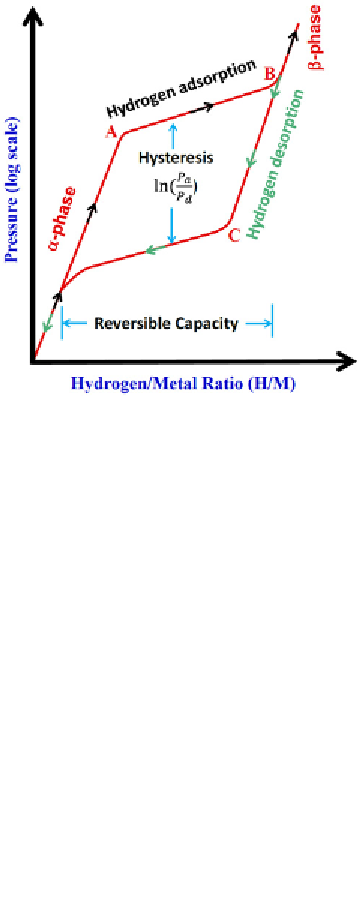
FIGURE 6.2
The typical PCT curves for the hydrogenation and dehydrogenation of a metal hydride
under a fixed temperature
T
. (See color insert.)
where
Q
is the heat of hydride formation. In general, the hydrogenation is
exothermic, while the dehydrogenation is endothermic. Practically, the
hydrogenation process happens at high hydrogen pressure, while dehydro-
genation occurs at low pressure. Figure 6.2 shows a typical pressure-
composition-temperature (P-C-T) curve during a hydrogenation and
dehydrogenation cycle. With the increasing hydrogen pressure, a metal starts
to adsorb hydrogen to form metal-hydrogen solid solution (
α
-phase). When
the pressure reaches “A” location shown in Figure 6.2, the metal starts to
form hydride (
β
-phase). At this stage, the hydrogen pressure (
P
A
) almost
remains as a constant while the hydrogen content increases significantly. The
hydrogenation process will be complete at “B” location. This A-B adsorption
plateau characterizes the effective hydrogen storage capacity at a fixed tem-
perature. In general, the adsorption plateau pressure will increase with tem-
perature, and follow the van 't Hoff relation [2],
∆
H
RT
∆
S
R
ln
P
=
−
,
(6.5)
where
P
is the hydrogen pressure, Δ
H
and Δ
S
are the enthalpy and entropy
of hydride formation or decomposition,
R
is the universal gas constant, and
T
is the temperature. The heat of formation can be obtained by plotting the
plateau pressure ln
P
versus 1/
T
(van 't Hoff plot), as shown in Figure 6.3
Search WWH ::

Custom Search