Environmental Engineering Reference
In-Depth Information
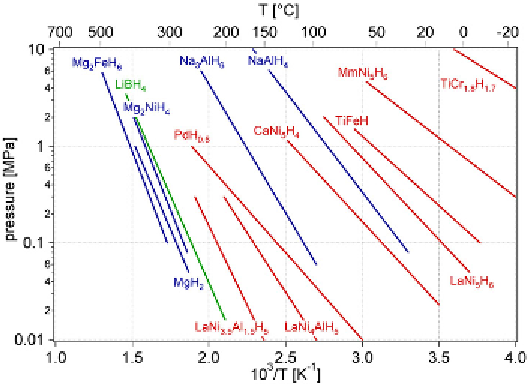
FIGURE 6.3
The van 't Hoff plots of several selected metal hydrides.
Source
: Reproduced with permis-
sion from Zuttel [3]. (See color insert.)
[3]. The dehydrogenation process is a reverse process as shown in Figure
6.2, and it also shows a desorption plateau with a lower near-constant hydro-
gen pressure
P
D
. The adsorption and desorption plateaus form a hysteresis
loop for the hydrogenation and dehydrogenation processes, and the free
energy difference associated with the hysteresis is given by
P
P
A
∆
G
hyst
=
RT
ln
.
(6.6)
D
The hysteresis represents a loss in the efficiency of the hydride due to
irreversible degradations of materials during hydrogenation/dehydrogenation
processes. A good hydride material should have a hysteresis as small as
possible.
The width of the plateau, Δ(
H
/
M
)
r
, as indicated in Figure 6.2, is defined
as the reversible capacity, which is usually smaller than the maximum (ideal)
storage capacity discussed earlier. This is an important parameter for practi-
cal applications.
6.2.3 Hydrogenation and Dehydrogenation Kinetics
The rates of hydrogen adsorption and desorption are two very important
parameters for characterizing metal hydrides. These rates depend on the
Search WWH ::

Custom Search