Environmental Engineering Reference
In-Depth Information
standards, presence of fructose, citric acid, lactic acid, acetic acid, and butyric acid
was detected. In addition, a few other peaks were observed, which were not charac-
terized due to lack of appropriate standards. It was found that the anode biocatalyst
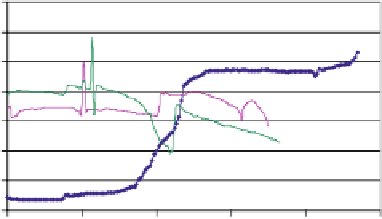
growth was slow using the wastewater as the sole nutrient source. The biocata-
lyst was therefore established using a defined nutrient medium containing glucose
and lactate at 0.2 g/L, each. After the biocatalyst was established, as indicated by
a current of 1 mA at a load of 250
(Fig. 5.2), the MFC was exposed to the
wastewater. The biocatalyst was first acclimated to 25% wastewater, mixed with
the nutrient medium (without amended carbon source), followed by operation with
100%wastewater. A current of 2.1 mA was obtained at a load of 100
with the 25%
wastewater stream. A similar current was obtained with the full strength wastewater
as well. However, the current rapidly dropped below 1 mA. The decrease in current
was due to a drop in pH. The wastewater was not ammended with any buffer salts
which was the primary reason for the drop in pH to below 6.0, within the two day
period. Adjustment of the pH to 7.0 reinstated the current output (Fig. 5.2). Thus,
pH control would be necessary for the MFC application. The MFC produced elec-
tricity continuously from 200 mL of wastewater for a period of 7 days at above 400
mW/m
2
power density (37 W/m
3
of total anode volume). A power density analysis
indicated a maximum of 470 mW/m
2
(Fig. 5.3). Operation of the MFC for three
additional days increased the power density to 690 mW/m
2
(54 W/m
3
). No further
increase in the power density was observed over the next month. An analysis of the
internal resistances of the MFC via electrochemical impedance spectroscopy (EIS)
indicated that the ohmic resistance was less than 10 ohms.
Typical power densities obtained using food industry wastewater as the energy
source have been in the range of 80-370 mW/m
2
[25, 39] (see further discussion
below). The power density obtained in this study is relatively higher than those
reported in literature. The primary reason for this is the MFC architecture which
lowers the internal resistance of the MFC as indicated by the low ohmic resistance
observed for this design. Further work on the assessment of the impedances via EIS
is in progess and will be reported elsewhere.
Biocatalyst growth
25% wastewater
100% wastewater
0.35
0.3
0.25
0.2
Fig. 5.2
Voltage output
during biocatalyst growth and
during use of wastewater as
the fuel source. The load on
the MFC was 250 and 100
0.15
0.1
0.05
during the growth period and
the wastewater testing period,
respectively
0
0
1
2
3
4
5
Time, days