Environmental Engineering Reference
In-Depth Information
taBle 11.7
Willow Biomass cropping system management and harvest schedule
year
season
activity
0
Fall
Mow, contact herbicide, plow, disk, seed covercrop, cultipack
1
Spring
Disk, cultipack, plant, pre-emergent herbicide, mechanical and/or
herbicide weed control
1
Winter
First year coppice
2
Spring
Fertilize
3
Spring
4
Winter
First harvest
5
Spring
Fertilize
6
Spring
7
Winter
Second harvest
(8-22)
(Repeat 3-year cycle for 3rd-7th harvest)
23
Spring/summer
Elimination of willow stools
Source:
Keoleian, G.A. and Volk, T.A.,
Crit Plant Sci Rev
, 24, 385-406, 2005.
Herbicide
production
Nursery
operations
Herbicide
production
Fertilizer
production
DM
DM
DM
DM
DM
DM
Field
preparation
Weed
control
Willow
biomass
Planting
Coppice
Fertilize
Harvest
7 3-year
rotations
D = diesel fuel production
M = farm machinery manufacturing
DM
Herbicide
production
Willow stool
elimination
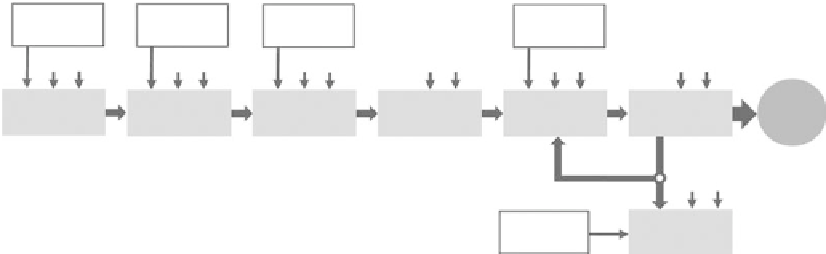
FIGure 11.20
Willow biomass production agriculture model. (From Keoleian, G.A. and Volk, T.A.,
Crit
Plant Sci Rev
, 24, 385-406, 2005.)
Keoleian and Volk (2005), building on previous work (Heller et al. 2003, 2004), provided a com-
prehensive assessment of the energy, GHG, air pollutant, land requirements, and economic impacts
of a willow biomass-to-electricity conversion system in New York state. Herein, the focus is placed
on the system's life-cycle energy balance.
The base case agriculture scenario in Keoleian and Volk (2005) followed the schedule described
in Table 11.7. Willow biomass yields were expected to increase 30-40% by later harvests, but wil-
low plants devote significant amounts of energy to establishing their roots in their first few years.
The willow biomass was assumed to contain 50% moisture by dry weight at harvest. Combustion
of this biomass would subsequently cause the power plant's efficiency to slightly decrease. The
agricultural model is outlined in Figure 11.20.
Combined biomass and coal combustion at a power plant (i.e., co-firing) was examined for two
90% coal/10% biomass scenarios, in addition to a baseline 100% coal input scenario. Co-firing
above 2% requires power plant modification; the impacts of these material requirements were
included in this study (retrofit material production in Figure 11.21). Manufacture of the original
power plant equipment was excluded because prior studies have shown it affects system life-
cycle indicators by less than 1% (Spath et al. 1999). The biomass-to-electricity system model is
outlined Figure 11.21. The functional unit in this analysis was 1 MWh of electricity delivered
to the grid.