Environmental Engineering Reference
In-Depth Information
System boundary
Material
resources
examples:
Iron ore
Limestone
Phosphate
Potash
Bauxite
Water
Willow electricity
life-cycle model
Farm equipment
manufacture
Retrofit material
production
Coal mining
and processing
Coal
Willow
Agriculture
model
Biomass
handling
Electricity
generation
Electricity
Biomass
Wood residues
Herbicide
production
Fertilizer
production
GHGs/air
emissions
Water
emissions
Solid waste
Normal residue
disposal
(avoided operation)
Energy
resources
examples:
Coal
Natural gas
Crude oil
Wood residue
source
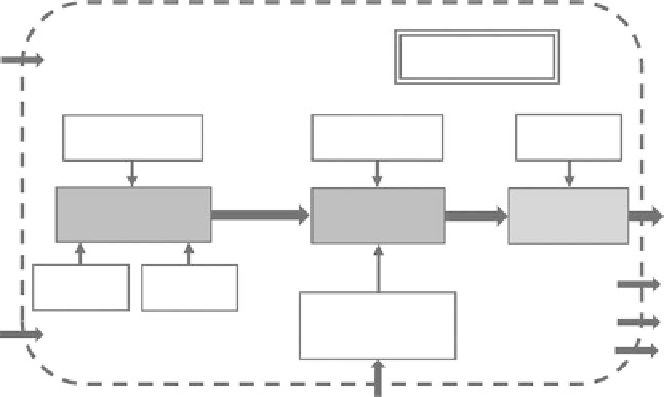
FIGure 11.21
Life-cycle model of willow biomass for electricity generation. (From Keoleian, G.A. and
Volk, T.A.,
Crit Plant Sci Rev
, 24, 385-406, 2005.)
Herbicide
manufacture, 3%
Agriculture chemical
transport, 2%
Farm machinery
manufacture, 3%
Fertilizer manufacture,
37%
Nursery operations,
9%
Diesel used in farm
equipment, 46%
FIGure 11.22
Primary energy distribution for the agriculture phase of willow biomass production. (From
Keoleian, G.A. and Volk, T.A.,
Crit Plant Sci Rev
, 24, 385-406, 2005.)
Fertilization and harvesting account for the majority of the primary energy required during
the agriculture phase of willow biomass production. Primary energy requirements by activity are
shown in Figure 11.22.
Heller et al. (2003) reported the agriculture NER (energy in the biomass at farm exit divided by
input fossil energy) to be 16.6 after the first crop rotation, but it cumulatively increased to 55.3 after
seven rotations. This value was higher than what was found in previous biomass studies because of
yield assumptions, fertilizer application rates, and slightly different boundaries. When prior study
results were recalculated to account for these differences and compared to the Heller et al. (2003)
results, the agriculture net energy ratios were proximate.
Heller et al. (2004) calculated the NER of the entire willow-to-electricity system as the power
plant electricity output divided by total life-cycle fossil fuel input. This metric offers the means
to compare the renewable energy benefit of different energy systems. The NERs for the co-fire
scenarios are approximately 9% better than the coal only case. However, the systems that relied on