Information Technology Reference
In-Depth Information
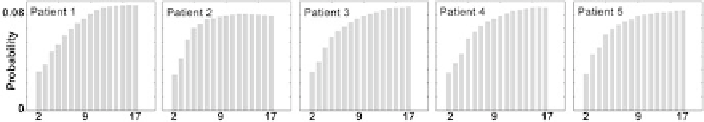
Fig. 4.6: The number of sources estimated by using the Bayesian information cri-
terion (BIC) from patient 1 to patient 5. Each panel shows the estimated posterior
probabilities (histograms) of a patient. A number of sources range from 2 to 17 (the
number of channels) were given for computing the posterior probabilities (Equa-
tion 4.6). It is evident that all the estimated posterior probabilities are comparable
in each plot when the source numbers are between 12 and 17.
4.4.2 CJD-Related Feature Extraction
We have observed that the distinct disease-related patterns were likely to occur in
different time windows. Three 15-s windows (Figs. 4.2a, 4.3a, and 4.4a) were se-
lected to illustrate the ICA results obtained from a 5-min EEG data. The resultant
independent temporal waveforms (patient 1, 73 y/o) were presented in Figs. 4.2d,
4.3d, and 4.4d, respectively, and the corresponding spatial maps elucidating CJD-
related characteristics or artifacts were depicted in Figs. 4.2e, 4.3e, and 4.4e, re-
spectively. The CJD-related components shown in Figs. 4.2d, e, 4.3d, e, and 4.4d, e
are the PLEDs lateralized to the right hemisphere (IC3), triphasic waves on the
occipital lobe (IC4), and the PLEDs (IC3) as well as the epileptiforms covering
the whole brain (IC5), respectively. The component IC2 was the artifact caused by
eyeblinks since the spikes occurred intermittently with irregular shapes and large
weights exhibited in the prefrontal area of the corresponding spatial map. Similarly,
IC8 was identified as an artifact due to left eye movements. The remaining ICs may
correspond to spontaneous brain activities irrelevant to CJD or artifacts and were
not taken into account in the analysis.
Figure 4.5 summarizes the individual CJD-related components from the other
patients. Each panel shows the selected temporal independent components and the
corresponding spatial maps for one patient. The ICA results from patient 2 (74
y/o), display generalized triphasic waves (IC1), PLEDs lateralized to the left hemi-
sphere (IC3), and slow waves at delta frequency (shaded area of IC6) (Fig. 4.5a).
In Fig. 4.5b, epileptiforms (IC6, IC7) and FIRDA (shaded area of IC8) were re-
solved from patient 3 (85 y/o). Figure 4.5c shows the prominent FIRDA over the
left frontal-temporal area (IC2) and the right frontal region (shaded area of IC4),
and epileptiforms on the right temporal-occipital lobe (IC6) from patient 4 (52 y/o).
Finally, Fig. 4.5d displays that the positive periodic triphasic waves appear predom-
inantly on the right occipital lobe (IC2), the PLEDs on the right frontal-central area
(IC7), and the diffused delta waves (IC8) from patient 5 (80 y/o).
Figure 4.7 shows the results when the 1-, 2-, 3-, 4-, and 5-min epochs of data
were analyzed by ICA. The bars with different colors in the Fig. 4.7a-e represent the