Information Technology Reference
In-Depth Information
experimental results 32 is:
Y
=
1
.
057
X
−
58 (
Y
: experiment result;
X
: simulated
result; R square
001;). Therefore, our model fits the data well.
Figure 9.8 compares of simulation and experiment results of the PRP effect at
the end of practice (after 7,200 fs trials). The linear regression function relating the
simulated results and experiment results is:
Y
=
0
.
984,
p
<
0
.
=
1
.
03
X
+
105 (R square
=
0
.
891,
p
001), therefore, our model accurately captures learning effects related to the
PRP effect.
<
0
.
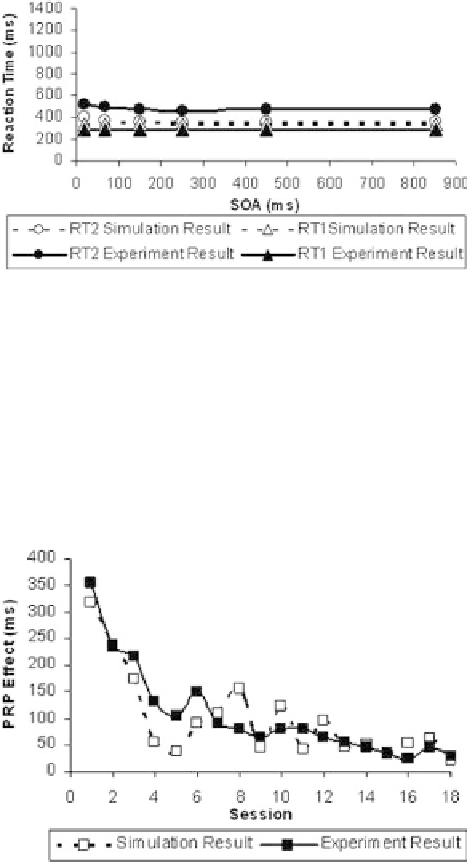
Fig. 9.8: Comparison of the simulation and experiment results at the end of practice.
Lastly, Fig. 9.9 shows the comparison of the simulation and experimental results
during the practice process (7,200 trials). The linear regression function relating the
simulated results and experiment results is:
Y
=
0
.
965
X
+
10 (R square
=
0
.
781,
p
001). Moreover, it was found that the
Q
value of the second route of task
2 never exceeded that of the first route of task 2 during the practice process as
<
0
.
Fig. 9.9: Comparison of simulation and experiment results during the practice pro-
cess (7,200 trials).