Biomedical Engineering Reference
In-Depth Information
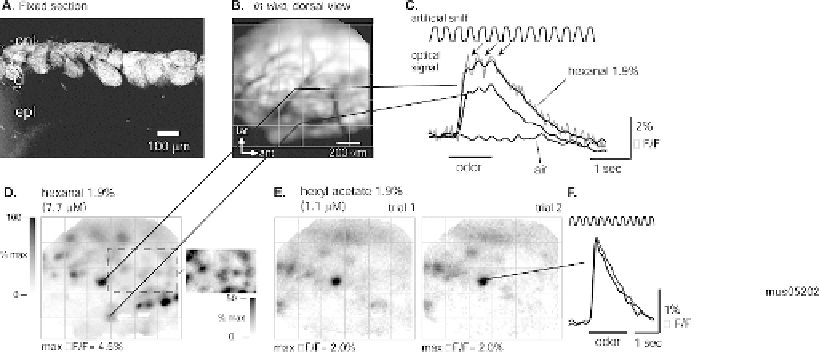
Fig. 3.9. Imaging mouse olfactory receptor neuron activation after in vivo loading with Calcium Green-1 dextran. (
A
)
Confocal image of a section through one olfactory bulb fixed 5 days after loading. Fixable rhodamine dextran (10 kD)
was used instead of Calcium Green dextran to preserve labeling in fixed tissue. Glomeruli are strongly labeled. There is
no evidence of transsynaptic labeling. onl, olfactory nerve layer; gl, glomerular layer; epl, external plexiform layer. (
B
)
Resting Calcium Green-1 dextran fluorescence imaged in vivo, 7 days after loading. The image was contrast-enhanced
to emphasize individual glomeruli. Blood vessels appear as dark lines. The saturated regions in the upper right are
from olfactory nerve bundles that obscure underlying glomeruli. Lines originate from two glomeruli whose responses
are shown in (
C
) and (
D
). (
C
) 1.9% hexanal evoked rapid (∼200 ms rise-time) increases in fluorescence in the two
glomeruli indicated in (
B
)(lines). Each trace shows the optical signal measured from one pixel and from a single trial
after band-pass filtering from 0.017 to 2 Hz. (
D
) Gray-scale map of the evoked signal for the trial shown in (C), showing
foci of fluorescence increases. A region of the map normalized to 50% of the maximum signal (inset) shows additional
smaller-amplitude foci. (
E
) The spatial distribution and amplitude of the signals was consistent across repeated odorant
presentations and was different for different odorants (D-E). Redrawn from Wachowiak and Cohen
(54)
.
Calcium Green-1 dextran loading resulted in labeling of olfac-
tory receptor axon terminals in the olfactory bulb (
Fig. 3.9A,
B
). We imaged odorant responses from the dorsal olfactory bulb
of anesthetized mice 4-8 days after loading. Odorant presentation
evoked rapid (100-500 ms rise-time) increases in fluorescence of
up to 9%
2.3.3. Example Results
F/F (
Fig. 3.9C
). Spatial maps of the response ampli-
tude measured from each pixel showed well-defined foci of fluo-
rescence increases (
Fig. 3.9D
), often corresponding to individ-
ual glomeruli visible from the resting fluorescence (
Fig. 3.9B
).
Odorant-evoked signals showed a range of amplitudes in differ-
ent glomeruli. Using an expanded gray scale (
Fig. 3.9D
, inset),
it is clear that even smaller signals have glomerular localization.
The spatial distribution and amplitude of the signals were consis-
tent across repeated odorant presentations (
Fig. 3.9E
) and were
different for different odorants (
Fig. 3.9D-E
).
The noise in this measurement of fluorescence from trans-
ported dye is also consistent with expectations from a calcula-
tion of the shot-noise (see below). In measurements made at a
frame rate of 100 Hz, the number of photoelectrons per pixel
per millisecond was approximately 2
10
4
. Because we digitally
×