Biomedical Engineering Reference
In-Depth Information
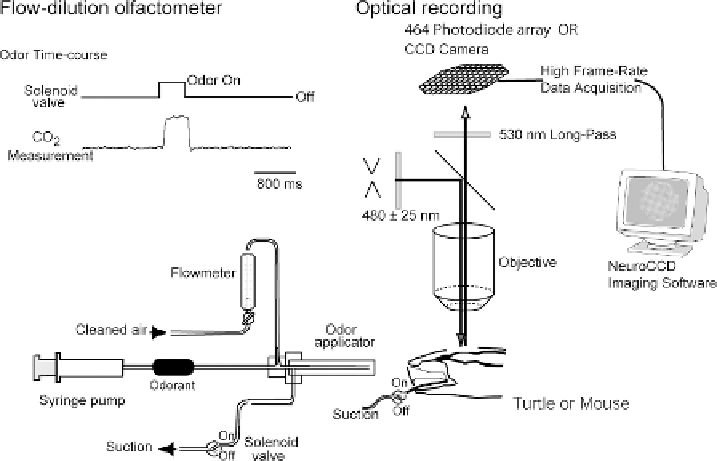
Fig. 3.8. Left Panel: Top: Time course of the odor output from the olfactometer measured by monitoring the CO
2
in
the carrier gas. The upper trace shows the time-course of the command pulse delivered to the suction solenoid of the
outer barrel of the odor applicator. The lower trace is the output of the CO
2
detector probe. There is a delay of about
100 ms between the command pulse and the arrival of the pulse at the CO
2
detector. The odor-pulse is approximately
square shaped. Bottom: Schematic diagram of the olfactometer. Compressed air was cleaned, hydrated and then mixed
with room air saturated with odorant vapor in the odor applicator. The flow rates of the air and the odorant vapor were
controlled by a flow-meter and a syringe pump respectively. The odor-applicator had two barrels; the outer one was
normally under suction to remove the odor. Turning-off of the suction to the outer barrel releases odorant from the end
of the applicator. Right Panel: Schematic diagram of the optical imaging apparatus. The olfactory bulb was illuminated
using a 100 W tungsten halogen lamp or a xenon arc lamp. The incident light passed through a heat filter and a 480
± 30 nm band-pass interference filter and was reflected onto the preparation by a long-pass dichroic mirror (510 nm).
The image of the preparation was formed by a 10.5× or 14× objective lens onto an 80×80 CCD camera after passing
through a 530 nm long-pass secondary filter. The secondary filter is needed to block reflected incident wavelengths that
are transmitted by the dichroic mirror. (D. Vucinic, L. B. Cohen, S. Kosmidis, unpublished.)
discarded. After averaging, data from each pixel were temporally
filtered with a 1-2 Hz low-pass Gaussian and a 0.017 Hz high-
pass digital RC filter.
To correct for unequal labeling of glomeruli, the signal from
each pixel was divided by its resting fluorescence obtained at the
beginning of each trial. A significant part of the resting fluores-
cence arises from dye in axons running along the surface of the
bulb prior to entering in glomeruli. Because there is no detected
increase in calcium in axons
(58)
, this correction is only partially
successful. To construct the spatial maps of input to the bulb,
response amplitudes for each pixel were measured by subtracting
the temporal average of frames in a time window just preceding
the stimulus from a temporal average centered at approximately
the peak of the response.