Biomedical Engineering Reference
In-Depth Information
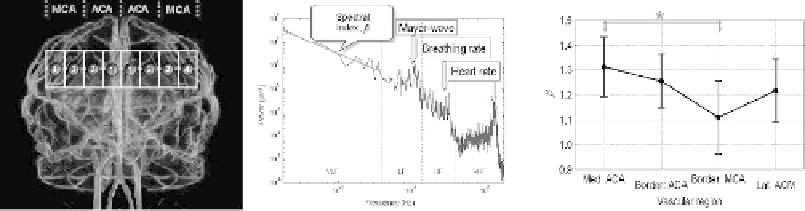
Fig. 2.7. Spatially mapped temporal complexity of CBV dynamics over the human brain cortex. CBV fluctuations were
mapped by NIRS across the anterior cerebral and middle cerebral arterial territories (left panel) in humans in a square
array of 16 regions. The total hemoglobin concentration, which is proportional to CBV, was measured on the forehead
of 12 young (males 21.5±0.8, females 22.3±1.4 years old) volunteers, in sedentary position for 20 minutes. Data from
the 16 channels of the NIRS LED imager were aggregated into four groups (medial ACA (anterior cerebral artery), lateral
ACA, medial MCA (middle cerebral artery) and lateral MCA). Spectral analysis revealed peaked (heart rate, breathing
rate, and Mayer waves) and self-similar frequency components in the signal (middle). The latter was found in the very
low frequency range (VLF) and was assessed by fitting for the regression slope through the VLF range of the spectral
estimates. The spectral index was found significantly lower for the MCA borderline zone indicative of a noisier fluctuation
pattern equivalent to a less rhythmic vasomotion of the monitored small arteries along the borderline MCA arterial tree.
(This study has been carried out with a significant contribution from Ms. Andrea Mile as a part of her student research
project in Dr. Eke's laboratory.)
hidden parenchymal thoroughfare channels can also be revealed
(
Fig. 2.6
). All this is possible as a result of a quantitative evalu-
ation of temporal complexity of spatially mapped temporal data
sets. One reasonable explanation of these findings is that the
Hurst exponents within the extra- and the intraparenchymal ves-
sels (pial arteries and veins, and capillaries, respectively) reflect
two distinct flow dynamics. While flow in the arteries and veins
is being influenced by rapid acceleration and deceleration result-
ing in anticorrelated patterns in the capillaries red blood cells flow
in a single file (“plug flow”) resulting in a strong correlation of
hemodynamic events.
Regional dynamic signals such as those mapped across the
frontotemporal regions of the human brain cortex (
Fig. 2.7
)
do contain a wide range of frequencies
(15, 27, 28)
. Fluctuations
within any given range of these frequencies (very high frequency,
VHF; high frequency, HF; low frequency, LF; very low frequency,
VLF) can be associated with an underlying energy source driving
the fluctuations: heart rate at
∼
1.2 Hz, breathing rate at
∼
0.3 Hz,
∼
and Mayer-waves at
0.11 Hz (
Fig. 2.7
, middle panel). Given
the fact that these frequency ranges are not produced by the vaso-
motion activity of the monitored cerebral vessels, they need to be
excluded from the fractal analysis if the intention is to character-
ize the complexity due to local factors such as vasomotion
(29)
.
The negative of regression slope (spectral index,
) fitted across
the VLF range of the CBV fluctuations is a measure of the fractal
correlation in the signal. A smaller
β
value indicates the presence
of a less correlated temporal fractal in any particular region. The
β