Biomedical Engineering Reference
In-Depth Information
7. Spatial
(2 Dimensional)
Surface Mapping
of Fractal
Parameter
The LDF and NIRS optical probes used in the animal and
human studies
(14-16, 22, 25)
(
F
igs. 2.3 and 2.5, respectively)
did not allow for sampling spatially mapped temporal complexity
in these dynamic signals. Therefore, more advanced techniques
were needed to gain access to the spatial dimension. Flow imag-
ing with LSI
(12)
was chosen to acquire high resolution maps of
red cell perfusion fluctuation in the brain cortex of anesthetized
rats and an NIRS imager enabled us to map CBV fluctuations
in 16 regions over the forehead and temporal regions in humans
(26)
. Both of these optical approaches generated surface maps
of temporal dynamics. Due to photon diffusion geometry in the
brain cortex and the particular imaging geometry of LSI, a sin-
gle voxel represents a tissue volume of
100 mm
3
, while that
in the NIRS imaging raster corresponds to
∼
3cm
3
. Our earlier
findings demonstrated that fluctuations in perfusion or vascular
volume are a fundamental and robust property of the cerebrovas-
cular system
(15)
.
F
igures 2.6 and 2.7 show topographic exam-
ples of temporal dynamics in the brain cortex where particular
“micro” (
Fig. 2.6
) or “macro” (
Fig. 2.7
)regionmayhavea
temporal fractal correlation pattern of its own, different from its
neighbors.
When spatial resolution of mapping is high as with LSI, these
differences create a functional map of cerebrovascular micro-
hemodynamics
(18)
, where arterial, parenchymal and venous
segments of the circulation can be easily discerned from the para-
metric images of the Hurst exponent and, in addition, otherwise
∼
Velocity map
View
Hurst exponent map
0.95
200
0.9
0
.85
150
0.8
0.75
0.7
100
0
.65
0.6
50
0.55
0.5
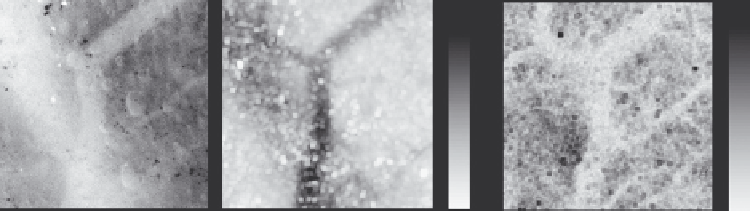
Fig. 2.6. Spatially mapped temporal complexity of microflow dynamics over the rat brain cortex. Exemplary parametric
maps are shown for spatial intensity (left), average microflow velocity (middle), and the Hurst exponents,
H
, calculated
for microflow fluctuations (right) in the rat brain cortex. The speckle contrast images (4096 images/150 s) were collected
from the rat parietal cortex with a Coolsnap CF camera with 256×256 resolution (voxel size: 16 μm
2
) at 655 nm. A
5×5 kernel was used to calculate flow velocity and the fractal parameter map was calculated from a stack of the 4096
flow velocity images. Note that the spatially mapped temporal fractal descriptor, H, forms a very articulate structural map
of the pial and intraparenchymal circulatory networks indicating that vasomotion/flowmotion patterns captured in the
corresponding perfusion time series are different and characteristic to these thoroughfare channels.