Biomedical Engineering Reference
In-Depth Information
is required to distinguish between these two signal types
(14)
.
In the former case, if self-similarity and a related fractal prop-
erty given by the power-law relationship can be demonstrated in
the time domain, the signal is termed fractional Brownian motion
(fBm). Its difference signal is fractional Gaussian noise (fGn), a
stationary time series
(14)
. Based on these two types of signal
classification, the fractal analytical tools can be split into three cat-
egories. Those that can be applied either to fGn (dispersional,
autocorrelation, Hurst's rescaled range, etc.; see below) or fBm
(scaled windowed variance, averaged wavelet coefficient, etc.; see
below) only, and a third one that can handle both signal classes
(spectral, detrended fluctuation, etc.; see below). If this corre-
spondence between signal classification and compatible tool of
analysis is disregarded or not fully appreciated, the fractal estimate
obtained by the analysis can end up being correct or meaningless
by chance
(6, 14)
.
Even if the proper tool of analysis is rationally selected, con-
siderations have to be given to the nature and degree of error in
the fractal estimate (Hurst exponent,
H
; spectral index,
β
; fractal
dimension,
D
). The performance of the analytical methods can be
evaluated on synthetic, ideal fractal signals generated in chosen
length and at a preset degree of fractal correlation correspond-
ing to a particular level of
H
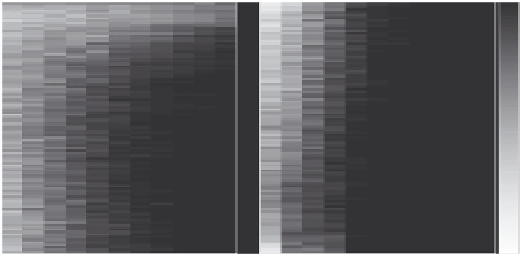
. The numerical testing shown in
Fig. 2.4
utilized the method of Davies and Harte (DHM)
(19)
to generate fGn signals that were converted to their fBm counter-
parts by summation
(14)
. These signals of 2
8
-2
18
in length were
analyzed by their class specific methods Disp (dispersional)
(20)
,
fGn
Di
s
p
fBm
bdSWV
%
0.99
90
0.8
80
70
0.6
60
50
0.4
40
30
0.2
20
10
0.01
2
12
2
14
2
16
2
16
2
12
2
14
2
16
2
16
2
8
2
10
2
8
2
10
Length,
n
Fig. 2.4. Evaluation of two robust fractal methods, the dispersion analysis, Disp, and
the bridge detrended scaled windowed variance analysis as a function of signal length.
Note that even though these methods are considered robust, their performance strongly
depends on the actual length of the time series data and the degree of fractal correlation
in the data set as expressed by the actual level of the Hurst exponent, H. For further
details, see text.