Biomedical Engineering Reference
In-Depth Information
complex systems of nature. In living systems, a certain degree of
complexity is what is considered normal
(8)
. Processes upsetting
this particular degree of complexity typically lead to pathology
and can be categorized as disease states
(8)
.
Sampled structures or processes of living biological systems
produce spatial and/or temporal signals. Depending on the spa-
tiotemporal resolution of the observation(s) and the presence of
intrinsic or extrinsic factors altering the observed signal(s), the
dynamics within the system can be revealed. Almost all biological
signals can be shown to be dynamic if the spatial or temporal win-
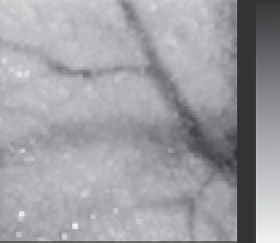
dow of the observation is properly chosen. For example, blood
flow measured in large brain areas, under resting conditions for
a minute or two, due to its minute fluctuations, can be regarded
as a temporal signal without significant dynamics. However, rest-
ing blood flow measured in “micro” areas, as measured by laser
speckle imaging
(12)
and as shown in
Fig. 2.1
, can exhibit great
spatial and temporal variations and hence should be regarded as a
dynamic signal.
Emergence of dynamics in biological behavior is not only a
function of the scale of observation but is fundamentally deter-
mined by the energy flux through the observed system (
Fig. 2.2
)
(13)
. At the low end of the energy flux, the system tends to equili-
brate at a non-zero steady level of operation or decay to zero level
(i.e., no operation). The higher the energy flux, the more pro-
nounced is the dynamic character of the signal, eventually reach-
ing a state of utmost complexity known as pure random behavior.
In between these two extreme states (i.e., equilibrium and ran-
dom), the physiological dynamics can be found surrounded by a
range of pathologic states.
RBC velocity map
RBC velo
c
ity time ser
i
es
500
300
ROI #1
3
250
0
500
2
ROI #2
200
0
1
500
150
ROI #3
0
100
0
5
10
15
20
25
30
35
40
45
Time,
s
Fig. 2.1. Spatialdistributionofmicroflowacrossthebraincortexanditstemporaldynamicsforthreeregionsofinterest.
Laser speckle flow imaging was used to map red blood cell perfusion at 252 × 252 voxel resolution for an area of 1
mm
2
in the brain cortex of an anesthetized rat. Intensity coded data are plotted on the left, while time series of sponta-
neous perfusion fluctuation is shown for a pial vein (1) artery (2) and parenchymal area (3). An apparent heterogeneity,
randomness dominates these signals, lending them a complex appearance.