Biomedical Engineering Reference
In-Depth Information
(D)
(C)
(B)
PCr
γ
-ATP
Pi
(A)
8.0
6.0
4.0
2.0
0.0
-2.0
(ppm)
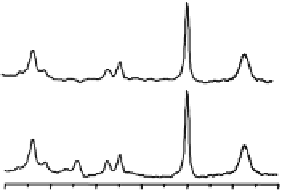
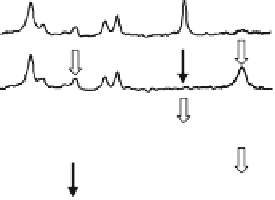
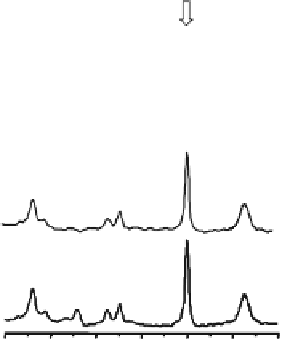
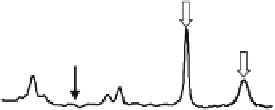
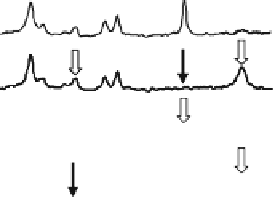
Fig. 15.12. In vivo
31
P MSS MT measurements and four spectra acquired from a rep-
resentative human occipital lobe in the absence (
A
) and presence of complete RF sat-
uration on the resonance peak of (
B
) Pi (Step 2), (C) PCr (Step 3) and (D) γ-ATP (Step
1), respectively. The narrow arrows indicate the saturation sites and the wide arrows
indicate the signal reductions due to the magnetization transfer. Adapted from Du et al.
of Ref.
(50)
.
of
PCr
Pi
. For instance, the PCr saturation results in
a significant signal reduction for both
↔
ATP
↔
-ATP and Pi as shown
in
Fig. 15.12C
. All required steady-state saturated magnetiza-
tions can be determined by using the three saturated in vivo
31
P
spectra as shown in
Fig. 15.12B-D
, and all equilibrium mag-
netizations can be determined by using the control in vivo
31
P
spectrum as shown
Fig. 15.12A
. The values of these magneti-
zations were used to determine four rate constants (
k
1
,
k
2
,
k
−
1
and
k
−
2
) and four fluxes (
F
ATP
ase
γ
,
F
ATP
ase
,
F
CK
f
and
F
CK
) asso-
r
r
f
ciated with the
PCr
Pi
exchange in the human brain.
These measured results and the ratios between the forward and
reverse fluxes are summarized in
Fig. 15.13
indicating sev-
eral important observations. First, there is no statistical differ-
ence between the forward and reverse exchange fluxes for both
the CK reaction (i.e.,
F
CK
f
↔
ATP
↔
versus
F
CK
;
p
= 0.38) and the
r
ATP
ase
reaction (i.e.,
F
ATP
ase
f
versus
F
ATP
as
r
;
p
= 0.46)
(50)
.Sec-
ond, the ratios between the forward and reverse fluxes for the
CK reaction (
F
CK
f
F
CK
/
=
0. 95
±
0. 12) and the ATP
ase
reac-
r
tion (
F
ATP
ase
f
F
ATP
ase
0. 21) are close to unity. In gen-
eral, the CK fluxes reflect the nonoxidative phosphorylation and
the ATP
ase
fluxes, in contrast, reflect oxidative phosphorylation.
Both of these phosphorylation pathways can contribute to the
total ATP production flux (i.e.,
F
total
f
/
=
1. 08
±
r
F
ATP
ase
f
F
CK
f
=
+
= 73.9
mol/g/min) and the total ATP utilization flux (i.e.,
F
total
μ
=
r
F
ATP
ase
F
CK
mol/g/min). The ratio between
F
total
+
= 76.9
μ
r
r
f