Biomedical Engineering Reference
In-Depth Information
CMRO
2
imaging study using 3D in vivo
17
O CSI combined with
the simplified model at 9.4 tesla for quantifying absolute CMRO
2
values in the rat brain at normal brain temperature (37
◦
C) (i.e.,
normothermia) and mild hypothermia (32
◦
C) conditions
(86)
.
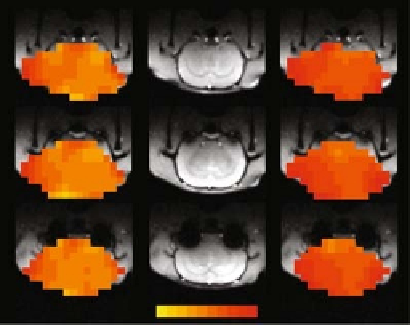
Figure 15.8A
illustrates an example showing three representa-
tive slices of 3D CMRO
2
maps from a rat brain under normother-
mic and hypothermic conditions. These images clearly show sig-
nificant reduction of CMRO
2
crossing the entire brain induced
by lowering brain temperature several degrees. This metabolic
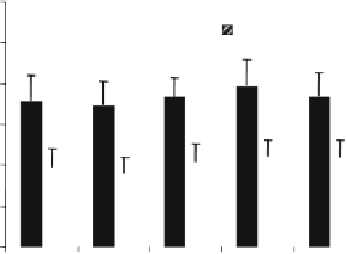
suppression occurring at hypothermia was consistently observed
in all five rats studied (
Fig. 15.8B
), resulting in an average of
45% CMRO
2
reduction as compared to normothermic condition
(86)
. These results indicate that the established in vivo
17
OMRS
approach is sensitive to determine the dynamic CMRO
2
change
(A)
3.0
(B)
T
=
37°C
T=37C
T
=
32°C
2.0
1.0
3.5
0.1
mol/g/min
mol/g/min
0.0
Rat 1
Rat 2
Rat 3
Rat 4
Rat 5
Fig. 15.8. (
A
)3DCMRO
2
maps of a representative rat brain obtained at normothermia (left column) and hypothermia
(right column), and their corresponding anatomic images (middle column). (
B
) Summary of CMRO
2
results measured at
normothermia and hypothermia conditions (n= 5). Adapted from Zhu et al of Ref.
(86)
.(
See
Color Plate)
3.0
2.5
2.0
1.5
1.0
0.5
0.0
0.0
0.2
0.4
0.6
0.8
1.0
CBF (ml/g/min
)
Fig. 15.9. Correlation of CBF and CMRO
2
values in the rat brains anesthetized with
α-chloralose at brain temperature range of 32-37
◦
C. The linear correlation coefficient
(R) was 0.97. Adapted from Zhu et al. of Ref.
(86)
.