Biomedical Engineering Reference
In-Depth Information
(C)
9
7
C
b
(t) (voxel)
5
3
C
a
(t)
1
-1
0
0.5
1
1.5
2
Time (min)
dC
b
(t)/dt = k
1
·
CMRO
2
+ CBF[k
2
·C
a
(t) - k
3
·n
·
C
b
(t)]
(B)
(A)
H
2
17
O Bolus Injection
17
O
2
inhalation
Fig. 15.4. Schematic diagram showing the multiple in vivo
17
O measurements for
determining CMRO
2
using the complete model according to the mass balance equa-
tion of
Equation (15.8)
which links Cb
(t)
,Ca
(t)
, CBF and n with CMRO
2
. To simplify
the equation, three known constants of 2
α
1
, mf
2
and m/
λ
used in
Equation (15.8)
are
replaced by k1, k2 and k3, respectively. (
A
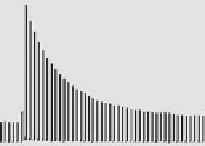
) Stacked plot of the
17
O spectra of cere-
bral H
2
17
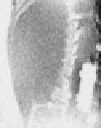
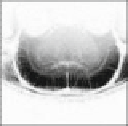
O tracer from one representative rat brain voxel as indicated by the circle in
the anatomical image (low center insert). The spectra were acquired before and after a
bolus injection of H
2
17
O for CBF measurements. (
B
) Stacked plot of the
17
O spectra
of the metabolic H
2
17
O
from the same representative voxel acquired before (natural
abundance), during (as indicated by the gray bar under the stacked plot) and after a
two-minute
17
O
2
inhalation. (
C
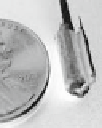
) Measurement of Ca
(t)
by using an implanted
17
ORF
coil (the left insert). The middle insert illustrates a
17
O spectrum of natural abundance
H
2
17
O obtained from the rat carotid artery blood by using the implanted RF coil before
H
2
17
O inhalation. The right insert shows the time course of Ca
(t)
(circle symbol) and
Cb
(t)
from a representative 3D
17
O CSI voxel (square symbol) in the same rat during a
two-minute inhalation of
17
O
2
. Finally, the ratio between the
17
O signal decay detected
after a bolus injection of H
2
17
O
(see
Fig. 15.4A
) versus the
17
O signal decay detected
after the cessation of
17
O
2
inhalation (see
Fig. 15.4B
) gives the constant of n. Adapted
from Zhu et al. of Ref
(54)
.
brain before the introduction of
17
O-labeled oxygen gas (see
Fig. 15.4B
) provides an excellent internal reference for quan-
tifying the absolute concentration of
C
b
(t)
for each CSI voxel
(54, 87)
. This self-calibration method is independent of the
17
O
detection sensitivity. This is particularly valuable when a surface
RF coil with nonuniform spatial distribution of detection sensi-
tivity is applied.
The arterial input function of
C
a
(t)
wasmeasuredinvivobyan
implanted
17
ORFcoil
(97)
wrapped around a carotid artery (in
the rat).
Figure 15.4C
illustrates the implanted
17
O RF coil, the
3.2.3. Other
Measurements