Biomedical Engineering Reference
In-Depth Information
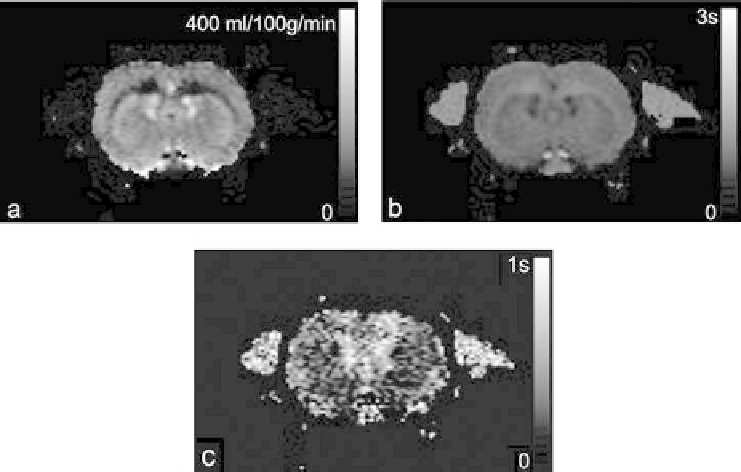
Fig. 13.3. Dynamic ASL parameter maps obtained from an isoflurane-anesthetized rat at 7 T. A 2 mm-thick coronal
slice that included the forelimb area of primary somatosensory cortex was imaged using a GE-EPI sequence with the
following parameters: TR/TE = 250/20 ms,
FOV
=
25. 6
×
25. 6mm
2
,matrix=
128
×
128
, image acquisition
time 49 ms. (
a
) CBF map obtained with high SNR and showing excellent anatomical definition of gray and white mater.
(
b
)
T
1app
map. (
c
) Transit time map.
compromising the tissue response information. In theory, this
should also enable to eliminate the contributions of large ves-
sels to the CBF map. Assuming that the arterial protons flow-
ing through the large vessels are flowing fast enough and do not
exchange with tissue, they should not behave as predicted by the
model in such a way that their contribution would be filtered
out of the data set and, thus, not considered in the final fitting
that would be used to generate a CBF map. After filtering, the
CBF,
T
1b
and transit time maps were obtained from the data
and are shown in
Fig. 13.3a,c
respectively. The average whole-
brain CBF value was 149 ml/(100 g
min) (
Fig. 13.3a
). Note
the high SNR of the CBF map. The transit-time map, shown in
Fig. 13.3c
, had an average value of 258 ms, which is in excellent
agreement with previously published values for the transit-time in
rats
(53, 65, 66)
.
·
3. Applications of
DASL to
Measurement of
the Hemodynamic
Response to
Functional
Activation
As mentioned above, the temporal resolution of ASL methods for
quantifying CBF is inherently low, due to the need to acquire two
distinct images and because proper perfusion contrast is achieved
only when enough time is allowed for the labeled spins to travel
into the region of interest and exchange with tissue spins. The