Biomedical Engineering Reference
In-Depth Information
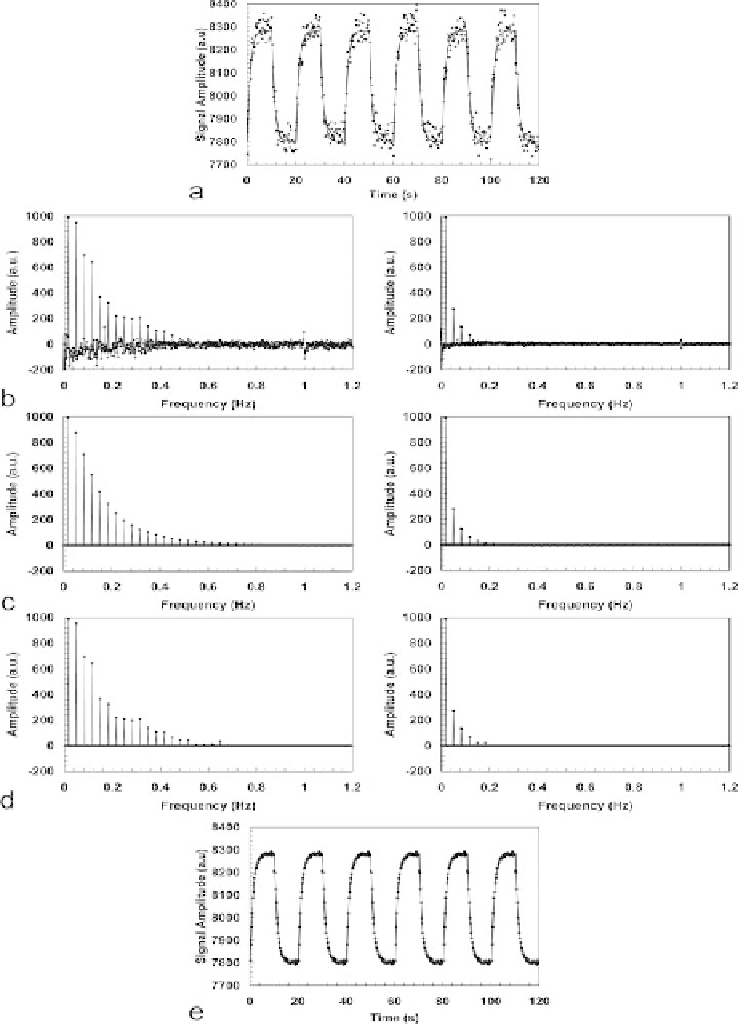
Fig. 13.2. Frequency filtering of DASL data obtained from an isoflurane-anesthetized rat at 7 T using a labeling frequency
of 0.05 Hz. (
a
) DASL time-course. (
b
) The real (left) and imaginary (right) components of the FT of the data. (
c
) The real
(left) and the imaginary (right) components of the FT of the best fit to the model expressed by
Equation (13.10)
.(
d
) The
filtered data based only on the frequencies allowed by the model. In addition to removal of the noise, the peak around 1
Hz due to the respiratory frequency is also filtered out. (
e
) The filtered DASL time-course.