Biomedical Engineering Reference
In-Depth Information
coefficient was a “failure”. In six out of a total of seven rats
imaged, exsanguination led to an increase in the mean correlation
coefficient in the cortex. Thus, with six “successful” trials out of a
total of seven, and for a probability of success in each trial as 0.95,
the chance of observing six or more successes in seven trials was
95.562%. This implied our underlying hypothesis to be valid. In
six rats where our hypothesis was valid, the difference between the
mean correlation in different anatomical regions was tested using
a paired t-test during normal and exsanguinated conditions. As
shown in
Table 12.2
, the error probability in the paired hypoth-
esis test for significant difference between regions decreased
during exsanguination when compared to normal condition.
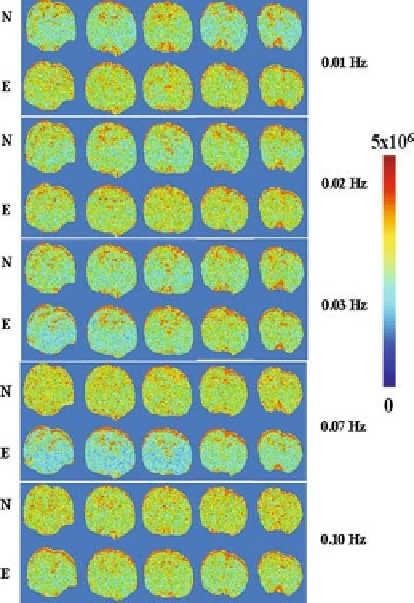
Spatial distribution of the low frequency fluctuations in the
whole brain was generated from specific frequency bands from
the power spectra of the signal time series on a voxel wise basis.
Figure 12.4
shows color-coded maps of the Fourier power of
specific frequency bands 0.01, 0.02, 0.03, 0.07 and 0.1 Hz from
Fig. 12.4. Spatial maps of low frequency fluctuations in the BOLD signal at distinct fre-
quencies in a typical rat during normal (N) and exsanguinated (E) conditions. Images
were derived from specific frequencies namely 0.01, 0.02, 0.03, 0.07 and 0.10 Hz
respectively from the power spectra of the BOLD signal time series on a voxel wise
basis. Fluctuations in most of the low frequency bands increase spatially in the cerebral
cortex during exsanguination. (
See
Color Plate)