Biomedical Engineering Reference
In-Depth Information
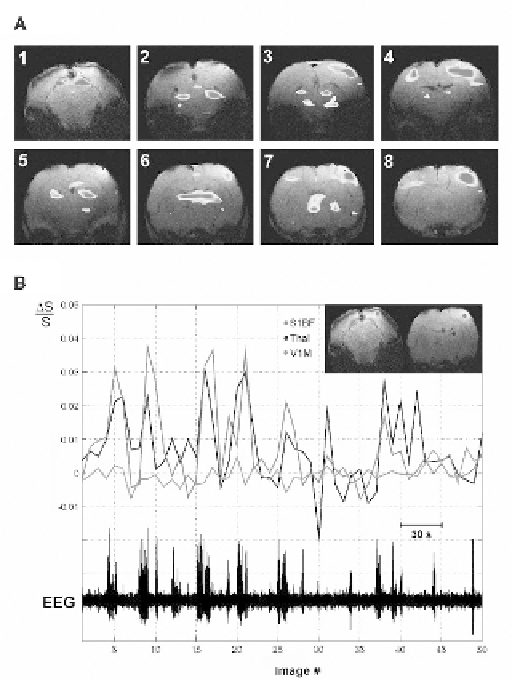
Fig. 9.4. Map of cortical and thalamic fMRI changes during spike-wave seizures in
WAG/Rij rat. (
A
) Example of BOLD fMRI activations during SWD in a WAG/Rij rat under
fentanyl-haloperidol anesthesia. t-maps were calculated from 23 pairs of images in
which a pair constituted one image acquired at baseline and one image acquired dur-
ing SWD. Results were overlaid onto corresponding high-resolution anatomic images.
The eight coronal slices displayed were acquired from back to front (numbered 1-
8) at 1-mm intervals. The first slice was at approximately -7.04 and the last slice
was at +0.40 mm relative to bregma (Paxinos and Watson, 1998). The frontoparietal
(somatosensory and motor) cortex, thalamus, and brainstem nuclei showed bilateral
and relatively symmetrical BOLD signal increases, whereas no significant changes were
seen in the temporal and occipital regions. t-map display threshold = 2. (
B
) Timecourse
of BOLD fMRI signal changes shown with simultaneous EEG during spontaneous SWD.
The onset of most SWD episodes, particularly those lasting more than 3 seconds, pre-
cedes increases in the BOLD fMRI signal (
S/S) in barrel cortex (red line, S1BF) and
thalamus (blue line, Thal). The primary visual cortex (green line, V1M) demonstrated no
significant changes related to seizure activity. Same experimental run, and same animal
as in A. Reproduced with permission from Nersesyan et al 2004B, JCerebralBloodFlow
Metab
(15)
. Color version of this figure can be viewed in the original publication
(15)
at http://www.nature.com/jcbfm/.