Biomedical Engineering Reference
In-Depth Information
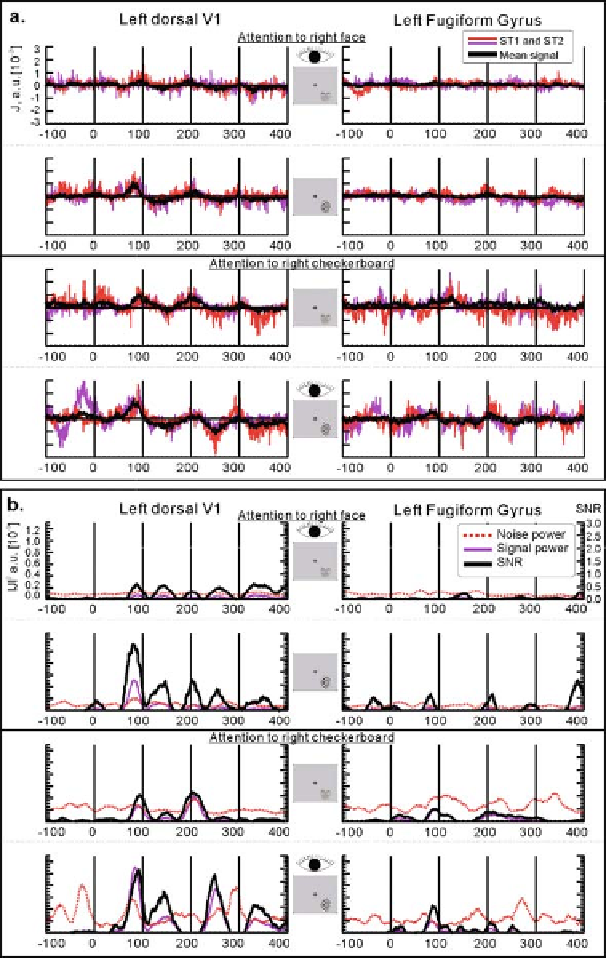
Fig. 8.2. (
a
) Two single trial activation curves extracted from tomographic MFT solu-
tions with region of interest in the left dorsal V1 and the Left FG, for stimuli presented on
the contralateral (lower right) part of the visual field. The stimuli in rows 1 and 3 were
faces and in rows 2 and 4 checkerboard oval pattern. During a run, stimulus type and
location varied randomly and the subject attended either to the faces on the right (rows
1and2) or to the checkerboards on the right (rows 3 and 4). For each case, two single
trials and the average of the six trials used in the run are displayed. (
b
). The signal and
noise power and their ratio (signal to noise ratio) are computed for the six trials and are
displayed for each of the cases in (
a
). (
See
Color Plate)