Biomedical Engineering Reference
In-Depth Information
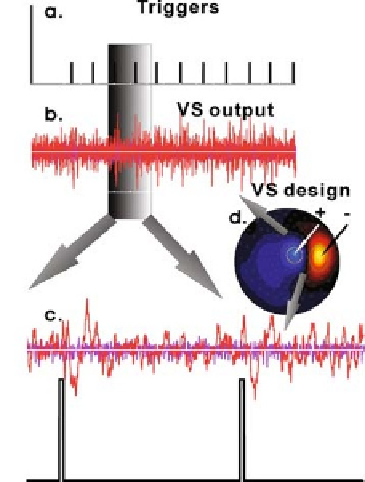
Fig. 8.1. Virtual sensor output for a strong signal. (
a
) The delivery of a median nerve
stimulation is marked by a trigger and collected together with the MEG signal. (
b
) The
MEG signal for the real measurement as marked by the triggers in (
a
) and for a recording
of the noise level of the system (no subject in the MEG room). (
c
) A zoomed version of
the VS output (top) and corresponding third and fourth triggers. (
d
) The VS is computed
from the difference of means of the 7 most positive and 7 most negative MEG sensors.
(
See
Color Plate)
(
Fig. 8.1d
). Weaker stimuli, e.g. typical visual stimuli, or median
nerve stimulation below motor threshold, produce responses that
are not easily discernible from the background activity.
The second example (
Fig. 8.2
) shows the reliable extraction
of the expected (but relatively weak) activity through single trial
tomographic (MFT) analysis using only a small number
(6)
of
trials.
Figure 8.2a
shows single trial activations (purple and red
curves) for left visual cortex and fusiform gyrus (FG) elicited by
face and checkerboard stimuli presented in the lower right part of
the visual field. The left and right columns show results for activa-
tion curves from the left dorsal V1 and FG respectively. The differ-
ent rows show the responses when the presentation of the stimuli
and the subject's attention is on one or other category of stimuli.
It is critical to realize that these activation curves are extracted
from tomographic solutions for each timeslice and single trial and
they are much more specific than any signal or virtual sensor for
that matter. Since the solutions are obtained independently for
each timeslice and trial, simple but powerful estimates of the sig-
nal power (SP) and noise power (NP) and hence their ratio, sig-
nal to noise power (SNR) can be obtained from the activation
curves of only six trials using 20 ms sliding windows across the