Biomedical Engineering Reference
In-Depth Information
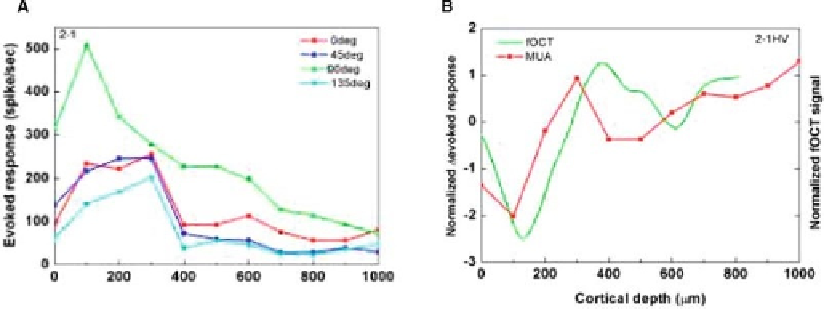
Next, to investigate what the patches in fOCT maps repre-
sent (i.e., whether they represent a localization in the distribution
of neurons themselves or a localization of the secondary mech-
anisms that are behind the origin of the functional signals), we
recorded multi-unit activities (MUA) in the scanned region to
determine the correlation with the distribution of strength of
neuronal activity. MUA recordings were done with glass-coated
tungsten electrodes.
Figure 6.10A
shows a representative exam-
ple of the variation of MUA with respect to the cortical depth for
four different grating orientations. As seen from the figure, the
stimulus selectivity across a single track is retained. However, the
evoked response at different depths is not of the same magnitude
and it varies across depth with the response being the largest for
a depth of 100-400
m. This implies that, across the depth, all
neurons do not behave in the same way and they have individual
characteristics as would be expected from an ensemble of neurons.
We would like to emphasize this variation in the evoked response
and we expect this variation could be detected by the proposed
fOCT measurement.
Figure 6.10B
shows an example of the result of a compar-
ison of the fOCT depth profile with the MUA profile. Variation
of the fOCT profile generally agrees with the non-uniformity of
evoked response across different depths. This suggests that the
functional signal measured by fOCT may be correlated with the
spiking activity of neurons. A calculation of the correlation coef-
ficient revealed that the profiles are well interrelated. Results of
correlation obtained from six different scan positions and three
different cats are presented in
Table 6.2A and B
, respectively.
Except for two cases, the correlation coefficient was fairly high,
indicating that fOCT could indeed measure functional maps.
μ
Fig. 6.10. An example of (
A
) MUA-evoked responses as a function of depth obtained from a single track for different
orientation stimuli and (
B
) a comparison of difference of the evoked MUA response (shown in red) with the fOCT profile
(shown in green) as a function of depth for the difference of 0
◦
minus 90
◦
orientation stimulus. (
See
Color Plate)