Biomedical Engineering Reference
In-Depth Information
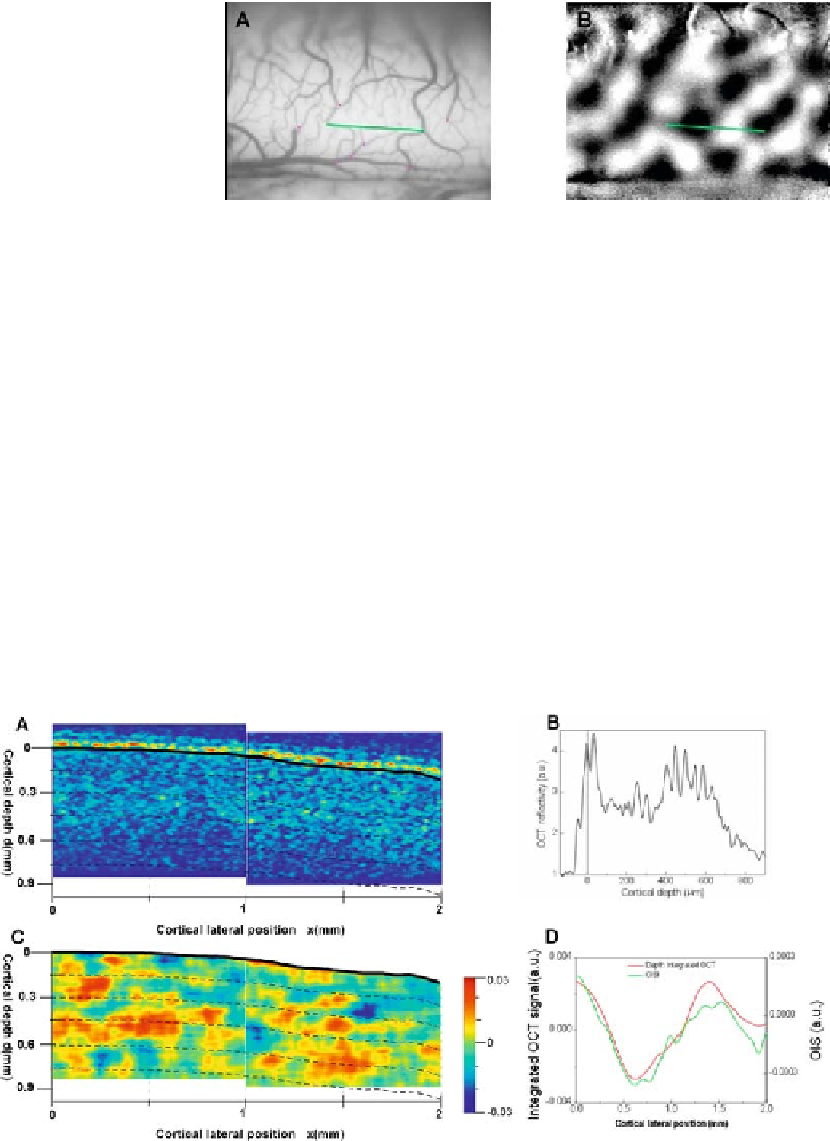
Fig. 6.8. (
A
) Exposed cortical surface of cat visual cortex with (
B
) a thresholded activa-
tion map overlay . Dark and light patches represent the activated regions for horizontal
and vertical gratings, respectively, and greenlinesindicate the region of OCT scans. (
See
Color Plate)
An OCT
x
-
z
scan was then conducted across the green line
indicated in
Figure 6.8
.
Figure 6.9A
shows the results of the
OCT structural
x
-
z
image obtained. The cortical surface border
has been drawn manually and the warm-colored regions indicate
the scattering centers within the cortex. Here, the light beam was
adjusted to be incident normal to the cortical surface and at a
position of interest in relation to the cortical surface. The depth
profile showing the intensity variation as a function of depth is
shown in
Fig. 6.9B
.
Figure 6.9C
shows the calculated fOCT
map obtained as a difference of the fOCT maps collected for
horizontal and vertical grating stimuli obtained across the green
line of
Fig. 6.8
(see Appendix 2 for calculation used to extract
Fig. 6.9. (
A
) OCT scan obtained across the line indicated in Fig. 6.8 with (
B
) a typical depth reflectivity profile from (
A
)
and the corresponding (
C
) Functional OCT map and (
D
) Consistency of OISI result with the integrated result of fOCT. In
(
C
),
red
and
blue
patches represent the activated regions for horizontal and vertical gratings, respectively. In (
D
)green
line indicates the variation of OISI across the line indicated in Fig. 6.8B. while the
red line
obtained by calculating the
functional signal from integrating the OCT scans across the full scanned depth range of Fig. 6.9A. (
see
Color Plate)