Geology Reference
In-Depth Information
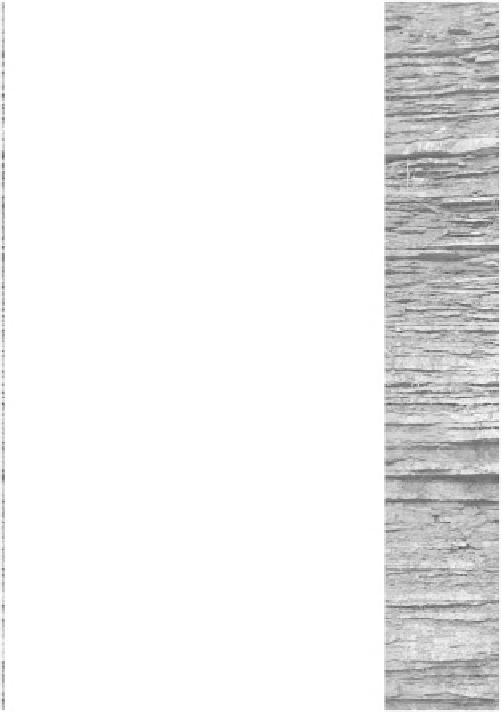
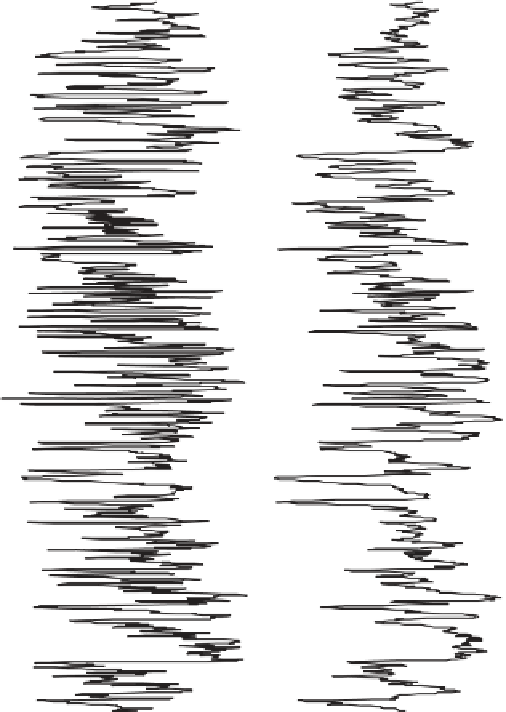
Fig. 9.
Cropped photographs and
grey-scale traces of a portion of an outcrop
of the Bellview Formation, Ordovician,
northern Kentucky, USA. On the right is
a 1-m-wide scan of the outcrop. To the
left of the fi eld photograph is the grey-
scale trace averaged over each horizontal
row of pixels. Furthest left is a composite
of a 2-cm-wide scan through the centre of
the 1-m-wide photograph and the grey-
scale trace derived from that image. Note
that the thinly bedded grainstones of the
Bellview Formation produce a trace with
much more high-frequency and high-
amplitude variation than exhibited by
the shale-rich Kope Formation (Fig. 8).
2 cm Grey-scale Scan
1 m Grey-scale Scan
When evaluating the stratal characteristics of
the Bellview Formation several observations are
readily apparent. First, the Bellview consists of
a succession of thinly bedded grainstones and
packstones with signifi cantly less interbedded
shale than found in the Kope. Second, the ambi-
ent light conditions at the time the photograph
was taken and the lack of shale results in thinner
and less pronounced shadows than in the case
of the Kope. Following the procedure discussed
above, two scans of the Bellview exposure were
subjected to grey-scale analysis. The larger ver-
tical extent of the Bellview outcrop coupled
with the thin bedded nature of the grainstones
results in a very complex grey-scale trace
(Fig. 9). This illustration displays 4.79 m of
section with a pixel scale of 3.14 mm. When con-
sidering the traces from the 1 m and 2 cm scans,
the higher frequency variation in the grey-scale
values makes visual comparison between the
two somewhat diffi cult. However, gross trends
and sharp breaks in contrast are recognizable in
both datasets.
In order to expand the analysis of these
grey-scale datasets, Fourier power spectra were
calculated for each of the four scans using
the standard techniques of Davis (1986). All four
examples describe a log-log linear decrease in
spectral power with increased harmonic num-
ber (Fig. 10). While the overall patterns of these
spectra are similar, there are some striking dif-
ferences. In the Kope example, there is a signifi -
cant reduction in the slope of the log power-log
harmonic number relationship wherein the slope
changes from
1.47. This reduction
in slope is a refl ection of the greater degree of
high-frequency variation in the 2-cm-wide scan.
That is, there is more spectral power over higher
frequencies than is observed in the smoother,
low-frequency dominated, 1-m-wide scan (Fig. 8).
The grey-scale values derived from the photo-
graph of the Bellview Formation (Fig. 9) display
signifi cantly greater degrees of high-frequency
variation than do those taken from the Kope
Formation photographs (Fig. 8). This difference is
evident not only by visual inspection of the
2.05 to