Geology Reference
In-Depth Information
Kope Formation is dominated by low-frequency
shale-limestone alternations (closer to Brownian
noise) while the Bellview Formation is dominated
by high-frequency shale-limestone alternations
(closer to white noise). Thus, when used in this
way, the grey-scale technique does hold some
promise as a tool for recognizing and quantifying
bed geometries.
Kope Formation
1 m grey-scale
Bellview Formation
1 m grey-scale
3
3
1
1
m
=
−
2.05
m
=
−
0.74
−
1
−
1
2 cm grey-scale
2 cm grey-scale
3
3
1
1
m
=
−
1.47
m
=
−
0.61
FUTURE DIRECTIONS
−
1
−
1
0
1
2
0
1
2
Recently, workers have begun to apply advanced
imaging techniques to the analysis of sedimentary
outcrops by combining traditional fi eld observa-
tions conducted by standard section measuring
techniques with positional data derived from GPS
measurements and three-dimensional positional
observations (Adams
et al
., 2004; Bellian
et al
.,
2005; Redfern
et al
., 2007). These approaches
allow for the creation of highly precise digital
outcrop models that can then be the subject of
high-resolution quantitative analysis. While still
being refi ned, these techniques provide an excit-
ing approach to creating digital datasets suitable
for quantitative stratigraphic analysis.
Log harmonic number
Log harmonic number
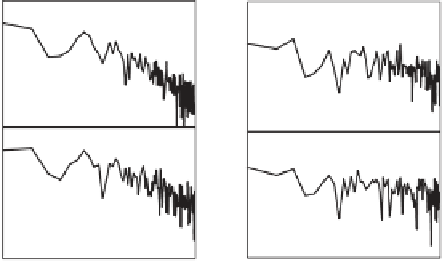
Fig. 10.
Power spectrograms of the four grey-scale traces
illustrated in Figs 8 and 9. For the 1-m-wide scan of the
Kope Formation, the grey-scale pattern exhibits a Brownian-
like shape, with log power-log harmonic number slope
of
2.05. The 2-cm-wide scan of the Kope Formation,
however, displays greater high-frequency variation and
thus a shallower slope of
1.47. Conversely, the Bellview
Formation grey-scale traces exhibit patterns much closer to
a white noise spectrum (
0.61 log-log slopes).
These traces are dominated by high-frequency variations
associated with the thinly bedded grainstones typical of
the Bellview Formation. Also note there is signifi cantly
less impact on the slope of the log-log relationship when a
narrower scan of the Bellview Formation is measured.
0.74 and
traces, but also is clearly expressed in the power
spectral analyses of the series (Fig. 10). In the
case of the Bellview Formation, the slopes of
the log power versus log harmonic number rela-
tionships are much shallower than the Kope
Formation. Likewise, the difference in slope of
the power-frequency relationship between the
1 m and 2 cm scans is much less in the case of the
Bellview (
CONCLUSIONS
What conclusions can be drawn from this evaluation
of quantitative techniques of outcrop analysis?
1
Choice of scale of sample spacing can
affect the proxy sea-level curve generated
from the discrete facies sampling technique.
Likewise exclusion of highly diagnostic but thin
or infrequently occurring facies is of signifi cant
concern when forming interpretations drawn
from the proxy sea-level curve. Spatio-temporal
variation in the recognition of thin facies can
affect the reliability of time-series results drawn
from incomplete records of relative accommo-
dation space change.
Geometric orientation of outcrop bedding rela-
0.74 to
0.61) than in the Kope (
2.05
1.47) (Fig. 10).
How, if at all, can the spectral analysis of these
grey-scale traces be used to evaluate the strati-
graphic character of the two outcrops? In a wide
variety of natural systems, the spectral power
of a data series is found to scale inversely with
frequency. The relationship
P
(
f
) = 1/
fb
, where
P
(
f
) is the spectral power,
f
is the frequency, and
b
is slope of the power-frequency relationship
(e.g. Fig. 10), is the mathematical description of
these types of systems. Two well-known signal
types, white noise
b
= 0 and random walks or
Brownian noise
b
= 2, defi ne commonly occurring
natural end-member cases of the 1/
f
noise range.
Lateral averaging of pixel grey-scale values tends
to smooth the signal and thus increase the slope
of the power-frequency relationship. Clearly, the
two outcrops considered in this study display sig-
nifi cantly different spectral characteristics. The
to
2
tive to the rectilinear structure of a grey-scale
pixilated image can control the absolute strati-
graphic thickness represented by each pixel. If
the apparent strike of the beds changes across
the photograph, then the angular relationship
between up-section direction and the pixel
geometry can result in artifi cial trending in the
grey-scale data.
The angle of outcrop step-back can cause
3
foreshortening of lower portions of the outcrop