Geology Reference
In-Depth Information
3.5
3.0
2.5
2.0
1.5
1.0
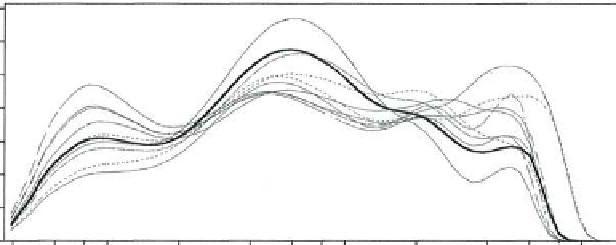
Fig. 9
Trimodal grain size distribution
for selected sediment reference markers
(
N
= 26) with peaks at 0.8 μm, 6 μm and
50 μm. Solid line indicates the mean
grain size distribution for all sediment
samples.
0.5
0
0.4
0.6
1
2
4
6
8
10
20
40
60
100
Particle diameter (μm)
are doubled (150 cm s
−1
), whereas maximum
ebb velocities are only slightly higher (93 cm s
−1
)
(Fig. 10a). Suspended sediment concentration in
the study area is very high compared with other
estuarine settings in south Florida: ~20 mg L
−1
at
Marco Island (Barron, 1976) and <20 mg L
−1
in
western Florida Bay (Lutz, 1997; Jones & Boyer,
1999). During calm weather, average sediment
concentration off East Cape is around 50 mg L
−1
.
Much higher concentrations, with peaks ranging
between 200 and 1100 mg L
−1
, are measured at the
various stations within ECC (Fig. 11).
Time-series observations of suspended
particulate matter at ECC entrance (Station 1)
and ECC North (Station 2) show a distinct signal
that mimics the daily inequality of the locally
predicted tides (Fig. 11a-c). Large sediment peaks
are recorded at the end of every 'high-amplitude'
ebbing tide. During spring tide, a secondary smaller
sediment peak coincides with the 'low-amplitude'
ebbing tide (Fig. 11a and b). Importantly, notice
the low levels of suspended sediment in incom-
ing tidal waters, whether spring or neap tide, on a
day-to-day basis.
On the western end of ECC, close to Lake
Ingraham (Station 4), time-series measurements
of suspended material do not show the same pat-
tern as at Stations 1 and 2 (Figs 10a and 11d).
On the contrary, sediment concentration is irregu-
lar through time and does not display a spring/
neap tide effect. Many sediment peaks coincide
with local high water level (Fig. 10a). Due to the
fact that current lags water level (Fig. 10b), a phe-
nomenon commonly recognized in estuaries (Van
Veen, 1950), the current is still directed inward
at high water and carries sediment towards Lake
Ingraham. However, sediment peaks also appear
at low water, and every so often at times of
highest (ebb or fl ood) velocities. A possible explan-
ation for this complicated sediment pattern is
the presence of several little creeks that exit
close to Station 4.
To ascertain the origin of the water mass that
carries the observed sediment peaks, time-series
measurements of salinity were made in combina-
tion with water level and turbidity, fi rst at ECC
North (Station 2) and two weeks later at Lake
Ingraham (Station 5) (Fig. 4). Data from both
stations show a clear, but contrasting, salinity
pattern related to the tide. Incoming fl ood waters
have normal seawater values of 35, whereas
outgoing waters are either hypersaline (up to 38)
(Fig. 12a) or brackish (25) (Fig. 12b). The sus-
pended sediment peak concentrations, appearing
more regularly at station 2 than at 5, are carried
seaward with these waters. These brackish or very
saline waters drain from the interior collapsed
marsh, where local rainfall and evaporation rates
can rapidly change the hydrological signature of
the water mass: 20-25 February 2005 was a dry
week, resulting in high salinities measured at
Station 2; 8-13 March 2005 was a rainy week, thus
resulting in low salinities measured at Station 5.
To determine whether the suspended particu-
late matter is related to the (brackish/very saline)
interior waters that it is carried by, organic carbon
isotopic values of the sediment in suspension were
measured simultaneously at Stations 1, 3 and 4
throughout a tidal cycle. End-member isotopic
values (Fig. 13a) include
13
C values of around
δ
−
27% for a peat dominated by sawgrass
(
Cladium
sp.) and mangrove (
Rhizophora
sp.)
(core 68 and 37), and ca.
26 to
−
21% for Florida Bay
water refl ecting mainly a marine phytoplankton
signal (Zieman
et al
., 1984; Lutz, 1997; Mead,
2003; Xu
et al
., 2006). Throughout the entire
ECC, the ebb tide carries isotopically lighter sus-
pended sediments than a fl ood tide (Fig. 13b).
The large sediment peaks that are observed at
the end of the ebb feature the lightest
−
13
C signal
δ