Geology Reference
In-Depth Information
Velocity (cm s
-1
)
150
(a)
Station 4: East Cape Canal West
3
2
100
1
50
3
2
Neap tide
Spring tide
0
1000
-50
500
0
30 July 04
1 August 04
3 August 04
5 August 04
7 August 04
9 August 04
11 August 04
Date
(b)
3.5
High water
3
2.5
Low
water
2
100
50
Incoming
current
0
Outgoing
current
-50
-
100
1 August 04
2 August 04
3 August 04
Date
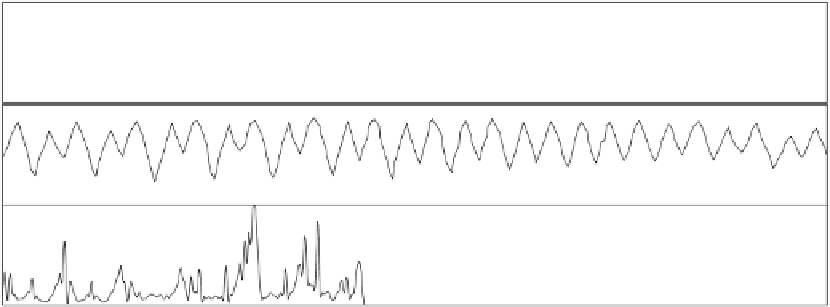
Fig. 10.
(a) Time series of velocity, water level and suspended sediment concentration, measured at Station 4 in East Cape
Canal in August 2004 with an ADCP and turbidity meter. The velocity time series shows an undulating vertical velocity
profi le, refl ecting velocities throughout the entire water column as the water level goes up and down. The colours refer to
the strength of the current: red and yellow tints being infl ow, blue and green tints being outfl ow. The darker the colour,
the stronger the velocities; (b) Detailed time series of water level and current velocities, demonstrating the time difference
between maximum (minimum) water level and the reversal of the current fl ow (up to 1 hour), a phenomenon commonly
observed in estuaries.
(sawgrass/mangrove); the incoming Florida Bay
water has a heavier
high water within HSC South (Station 3, Fig. 13b)
lags approximately 2 hours behind Stations
1 and 4. As seawater comes in on a rising tide,
the waters from the interior marsh are still drain-
ing from nearby HSC South and ESC (Fig. 4).
Plumes of dark brown water can be observed to
drain from HSC South into less turbid waters of
ECC, creating swirl pools and vortices as they
mix with incoming Florida Bay water on its way
to Lake Ingraham. Time-series measurements
combined with these fi eld observations suggest
a sediment pathway model, explained in the
following synthesis.
13
C signal (marine plank-
ton and seagrass). Station 1 displays the largest
isotopic range (from
δ
21.7‰). The least
varying carbon isotopic signal throughout the
tide is seen at Station 4 (
−
23.7 to
−
21.9‰). These
observations confi rm that the brackish to hyper-
saline waters and the suspended sediment that it
is transporting have the same origin: the collapsed
interior marsh.
The mechanisms for sediment input to the
major sediment sink of Lake Ingraham are pro-
vided by several fi eld observations. Low and
−
22.9 to
−