Information Technology Reference
In-Depth Information
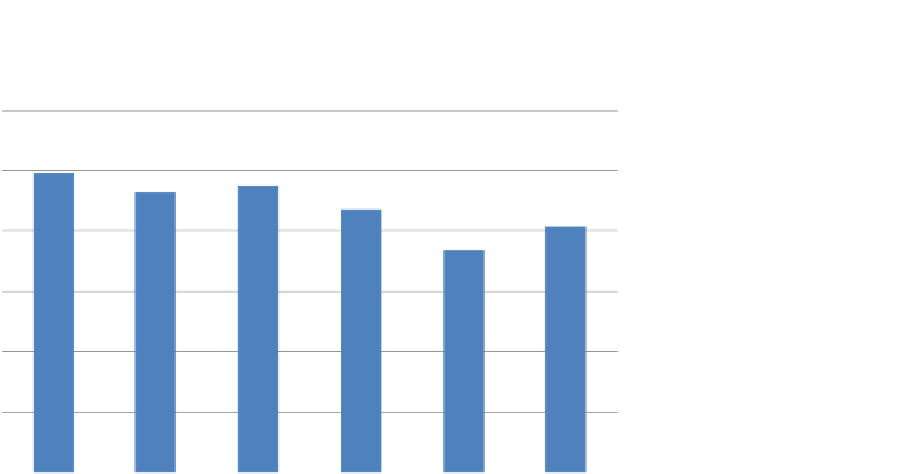
Percent Agreement: Difference Between Winning Category
& Next Category
60%
50%
40%
30%
20%
10%
0%
Framework 1
Framework 2
Framework 3
Framework 4Framework 5Framework 6
Figure 9.6 Comparison of six frameworks in six parallel closed card sorts. Because the frameworks had
different numbers of groups, a correction was used in which the percentage associated with the 2nd-place
group was subtracted from the winning group. Adapted from Tullis (2007); used with permission.
Data from a closed card sort can also be analyzed using hierarchical cluster
analysis and MDS analysis, just like data from an open card sort. These give you
visual representations of how well the framework you presented to the partici-
pants in the closed card sort actually worked for them.
9.2.3 Tree Testing
A technique that's closely related to closed card sorting is tree testing. This is
a technique where you provide an interactive representation of the proposed
information organization for a site, typically in the form of menus that let the
user traverse the information hierarchy. For example,
Figure 9.7
shows a sample
study in Treejack (
http://www.optimalworkshop.com/treejack.htm
) from the
participant's perspective.
Although the interface is very different, conceptually this is similar to a closed
card-sorting exercise. In a tree test, each task is similar to a “card” in that the par-
ticipants are telling you where they would expect to find that element in the tree
structure.
Figure 9.8
shows an example of data for one task provided by Treejack,
including the following:
•
Task success data
. You tell Treejack which nodes in the tree you consider
to be successful for each task.
•
Directness
. This is the percentage of participants who didn't backtrack up
the tree at any point during the task. This can be a useful indication of
how confident the participants are in making their selections.
•
Time taken
. Average time taken by participants to complete the task.


Search WWH ::

Custom Search