Information Technology Reference
In-Depth Information
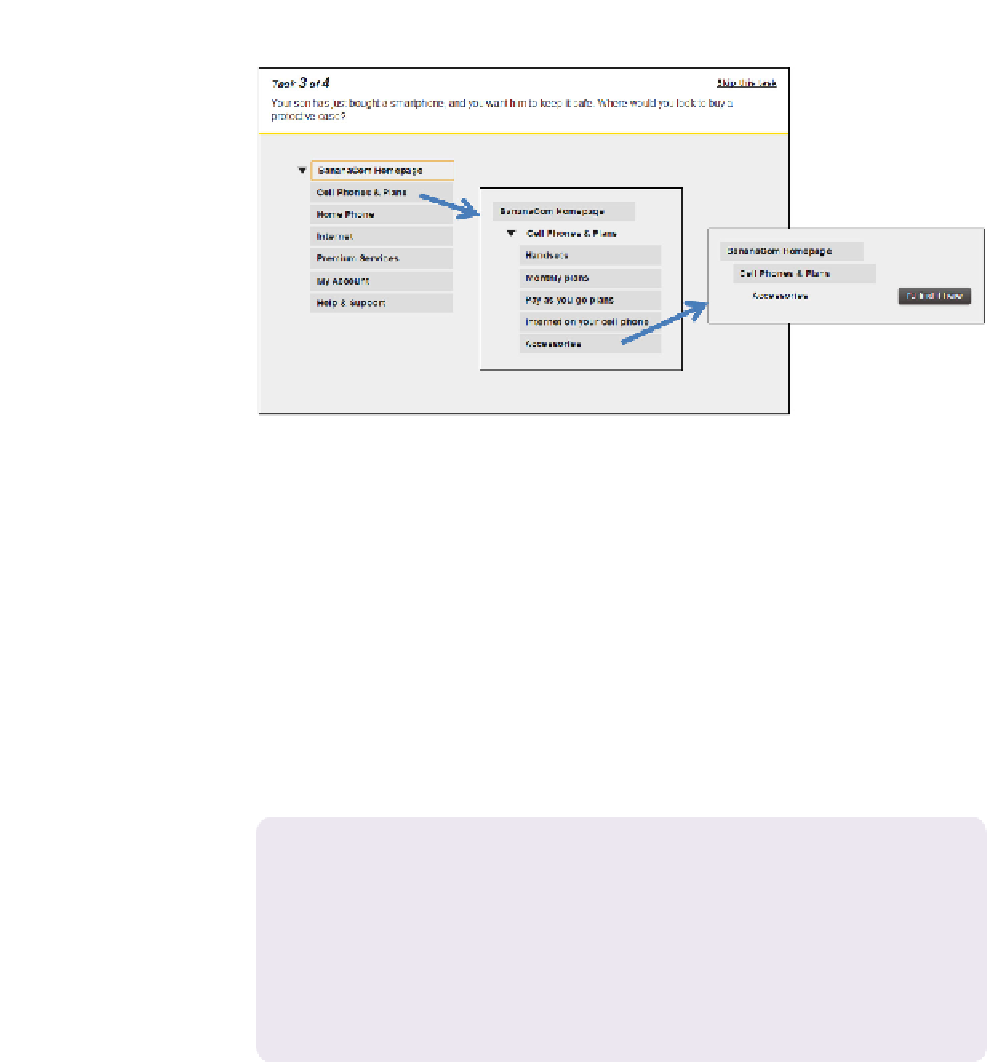
Figure 9.7 Sample study in Treejack. The task is shown at the top. Initially the participant sees only
the menu on the left. After selecting “Cell Phones & Plans” from that menu, a submenu is shown. This
continues until the participant chooses the “I'd find it here” button. The participant can go back up the
tree at any time.
And all three of these metrics are shown with 95% confidence intervals!
Treejack also provides an interesting visualization of data for each task called
a “PieTree,” shown in
Figure 9.9
. In this visualization, the size of each node
reflects the number of participants who visited that node for this task. Colors
within each node reflect the percentage of participants who continued down a
correct path, an incorrect path, or nominated a “leaf” node as the correct answer.
In the online version of the PieTree, hover information for each node gives you
more details about what the participants did at that node.
SOME TREE-TESTING TOOLS
The following are some of the tree-testing tools that we're aware of:
•
C-Inspector(
http://www.c-inspector.com
)
•
OptimalWorkshop'sTreejack(
http://www.optimalworkshop.com/treejack.htm
)
•
PlainFrame(
http://uxpunk.com/plainframe/
)
•
UserZoomTreeTesting(
http://www.userzoom.com/products/tree-testing
)
9.3 ACCESSIBILITY DATA
Accessibility
usually refers to how effectively someone with disabilities can use a
particular system, application, or website (e.g., Cunningham, 2012; Henry, 2007;
Kirkpatrick et al., 2006). We believe that accessibility is really just usability for a
particular set of users. When viewed that way, it becomes obvious that most of
Search WWH ::

Custom Search