Information Technology Reference
In-Depth Information
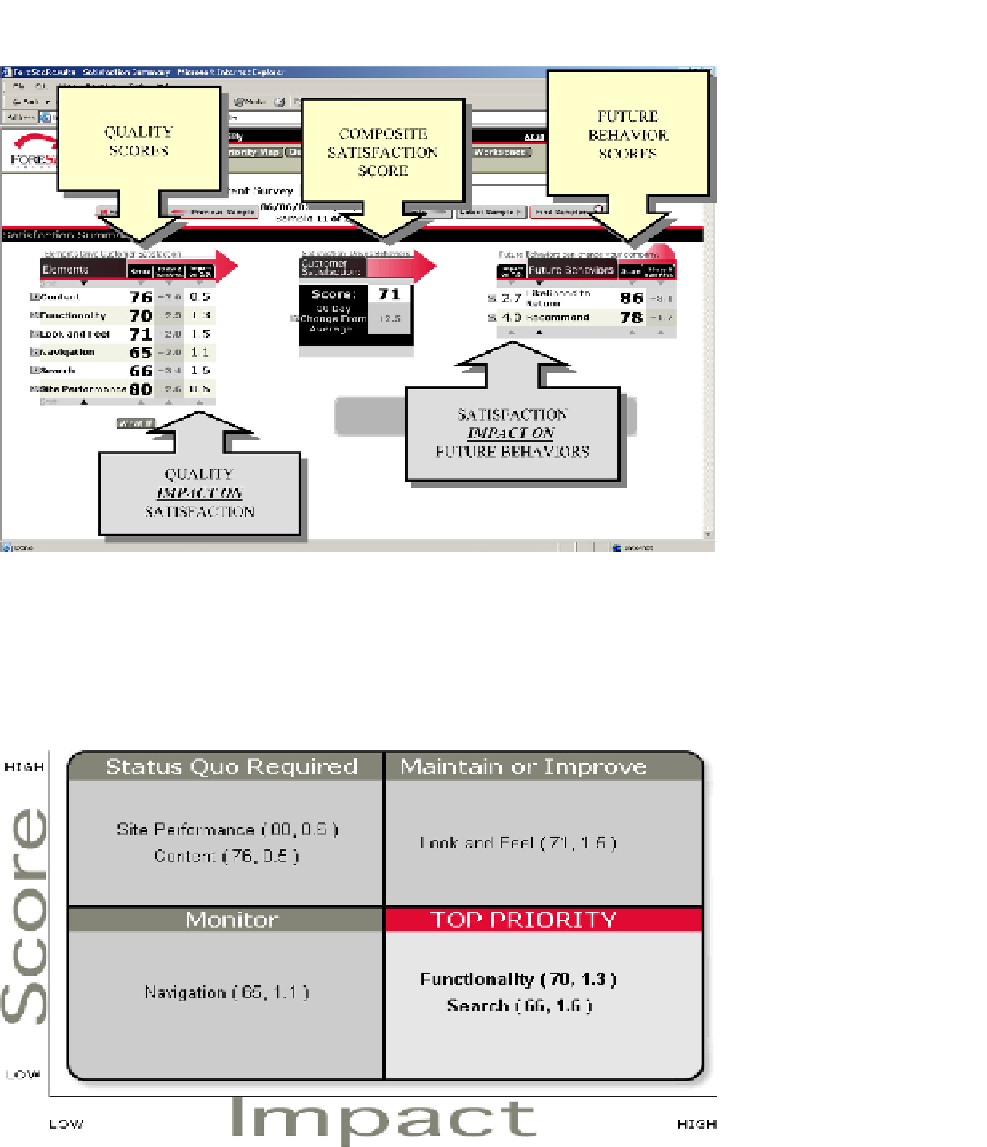
Figure 6.17 Sample results from an ACSI analysis for a website. Scores for six quality areas are shown
on the left, along with values estimating the impact that each of those scores has on overall customer
satisfaction, which is shown in the center. Scores for two “future behavior” areas are shown on the right,
along with values estimating the satisfaction impact on those areas.
Figure 6.18 Sample results from an ACSI analysis for a website. High and low scores for the six quality
areas are represented on the vertical axis, and high and low impact scores are shown on the horizontal
axis. The quality areas that fall in the lower right quadrant (Functionality and Search in this example)
should be your top priorities for improvement.
Search WWH ::

Custom Search