Database Reference
In-Depth Information
13.
Ve r i f y t h a t a n i t e m i n s i d e t h e p i e c h a r t i s s e l e c t e d i n t h e w o r k a r e a , a n d f r o m t h e
Data
menu select
Master Detail Relationships
.
14.
Click
New Link
.
15.
Ensure that
Product line
is selected in both
Master
and
Detail
panes.
16.
Click the
New Link
button again.
It will seem as though nothing happened; however, there are two links now, one on top
of the other.
17.
Click on the
Ye a r
in the
Master
pane and on the
Ye a r
in the
Detail
pane.
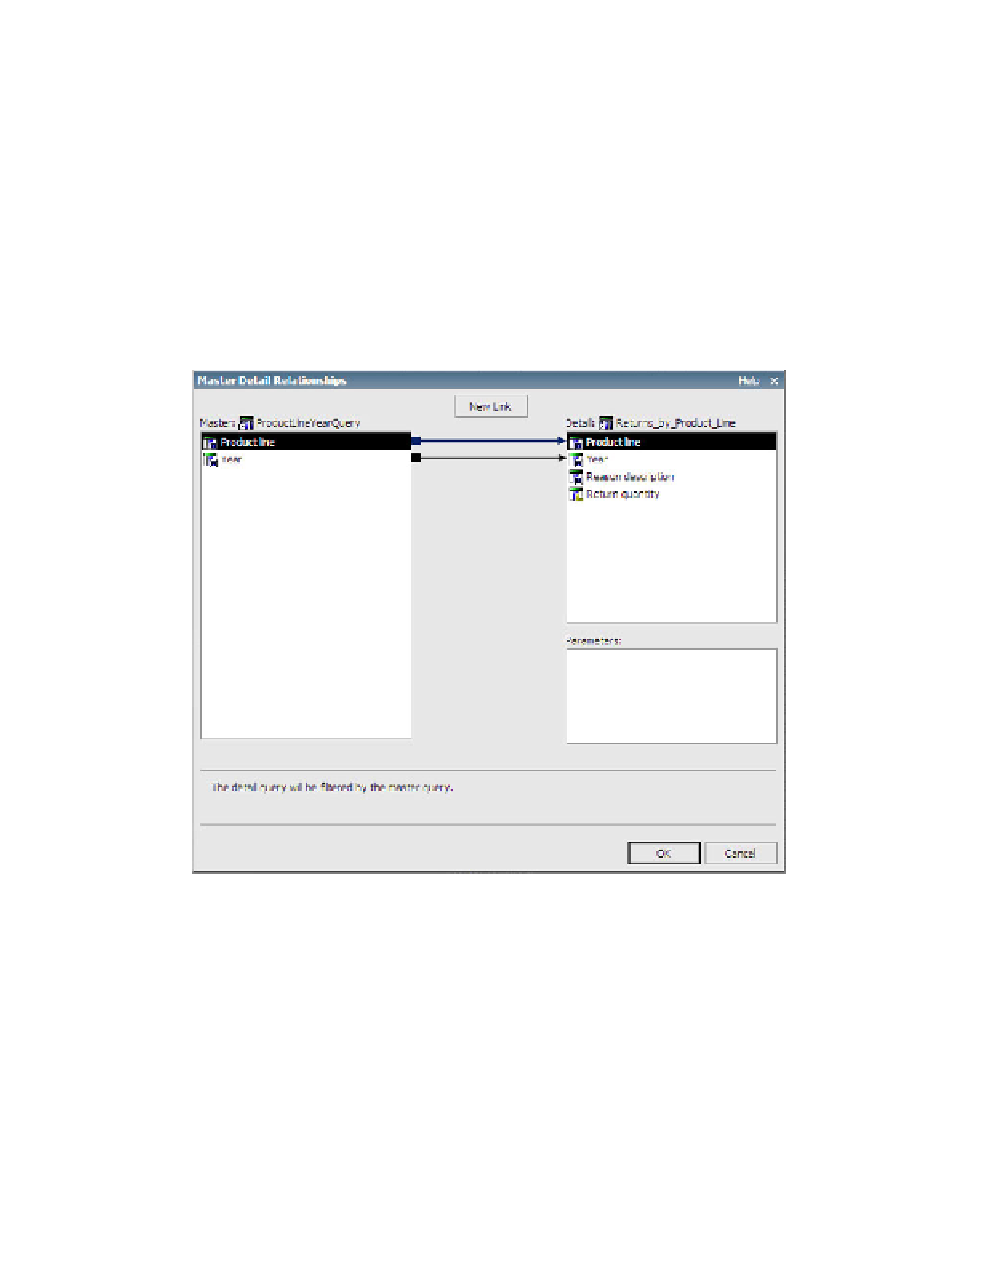
Yo u r second Master Detail Relationships window should look similar to Figure 6.33.
Figure 6.33
Second Master Detail Relationships dialog box
18.
Click
OK
to close the dialog box.
Now we can build the third object on the dashboard, the clustered line chart that we will
convert to a combination chart.
19.
From the
Data Items
tab, drag
Actual Months
from the
Shipping_Volume_by_
Month
query into the
Categories (x-axis)
drop zone of the line chart.