Database Reference
In-Depth Information
20.
Drag
Expected volume
into the
Series (primary axis)
drop zone of the line chart.
21.
Click on the chart background to select the whole chart object.
22.
In the
Properties
pane, double-click on the
Combinations
property.
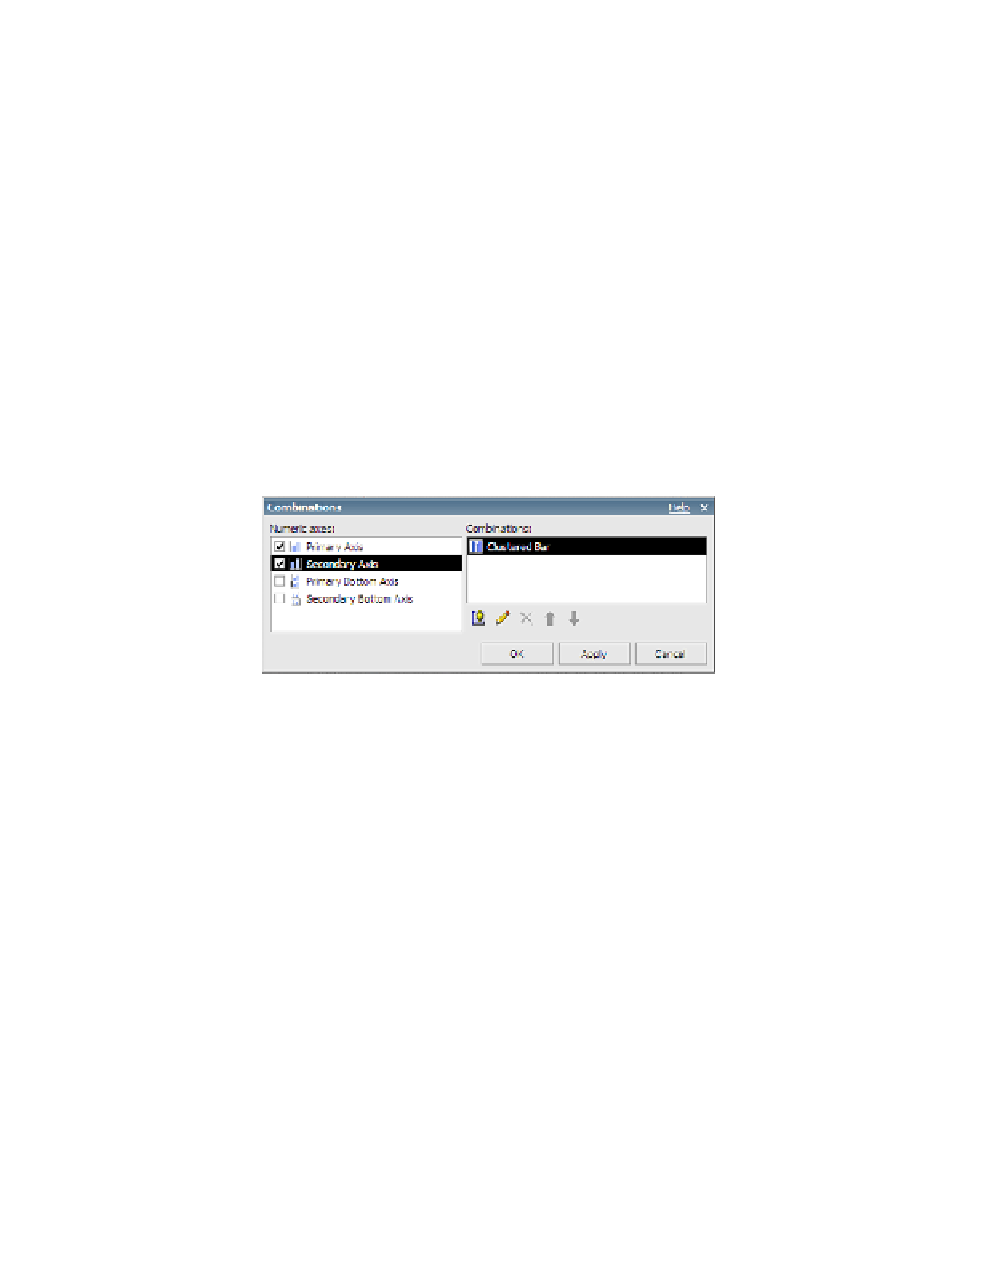
The Combinations dialog box opens.
NOTE
The new Combinations property gives you more power and flexibility to create
complex chart axes. It is quite different from the previous version, in which you had to
choose either the Y1 or the Y2 axis.
23.
In the
Numeric axes
area of the Combinations dialog box, click on the check box next
to the
Secondary axis
to select it.
By default, the
Combinations
area shows a
Clustered Bar
option.
Yo u r Combinations dialog box should look similar to Figure 6.34.
Figure 6.34
Combinations dialog box
24.
Click
OK
to close the Combinations dialog box.
The clustered line chart has now become a combination chart. You will notice a new
Series (secondary axis)
drop zone on the chart.
25.
From the
Data Items
tab, drag
Quantity shipped
from the
Shipping_Volume_by_
Month
query into the
Series (secondary axis)
drop zone of the combination chart.
26.
Ve r i f y t h a t a n i t e m i n s i d e t h e p i e c h a r t i s s e l e c t e d i n t h e w o r k a r e a , a n d f r o m t h e
Data
menu, select
Master Detail Relationships
.
27.
Click the
New Link
button.
28.
Ensure that
Ye a r
is selected in both
Master
and
Detail
panes.
Yo u r third Master Detail Relationships window should look similar to what's shown in
Figure 6.35.