Database Reference
In-Depth Information
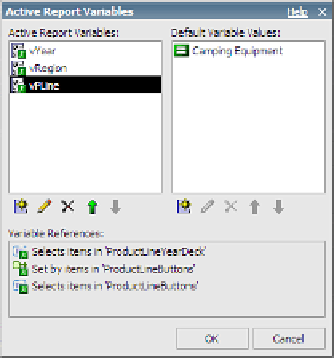
Figure 6.25
Updated Active Report Variables dialog box
Step 4: Insert Charts
In the following steps, we will insert the charts for our dashboard. We will start by adding the
three charts into the three data decks that have already been created.
1.
From the
To o l b o x
tab of the
Insertable Objects
pane, drag a
Chart
object into the
Data Card
area of the
RegionYearDeck
data deck.
This deck is in the top row and the second cell.
2.
In the Insert Chart dialog box, select the
Bar
chart group on the left and select the
Clustered Cylinder Bar with 3-D Effects
chart option.
3.
Click
OK
to create the data deck, as shown in Figure 6.26.
4.
From the
To o l b o x
tab of the
Insertable Objects
pane, drag a
Chart
object into the
Data Card
area of the
ProductLineYearDeck
data deck, which is in the third cell of
the top row.
5.
In the Insert Chart dialog box, select the
Pie
,
Donut
chart group on the left and select the
Pie with 3-D Effects and Rounded Bevel
chart option.
6.
Click
OK
to create the data deck, as shown in Figure 6.27.
7.
From the
To o l b o x
tab of the
Insertable Objects
pane, drag a
Chart
object into the
Data Card
area of the
Ye a r D e c k
data deck.
8.
In the Insert Chart dialog box, select the
Line
chart group on the left and select the
Clustered Line with 3-D Effect
chart option.