Geoscience Reference
In-Depth Information
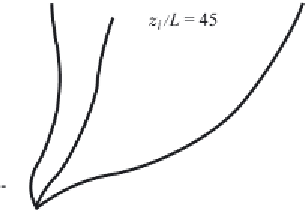
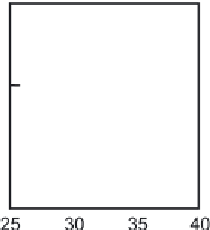
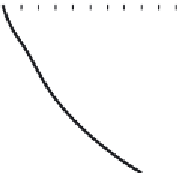
Figure 11.4 Mean wind profiles in a 45 north latitude ABL from the large-eddy
simulations of
Deardorff
(
1972a
). The mean wind shear above the surface layer
decreases sharply as
z
i
/L
increases. Neutral curves are read on the right axis,
unstable curves on the left.
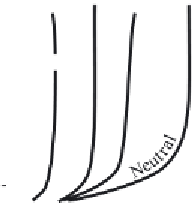
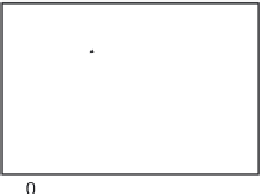
−
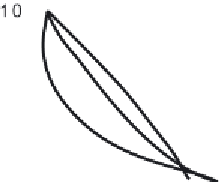
Figure 11.5 Streamwise (left) and lateral (right) turbulent stress profiles in theABL
as calculated through large-eddy simulation by
Deardorff
(
1972a
). Their curvature
is significant in the neutral case but decreases to nearly zero at
−
z
i
/L
=
45. Neutral
curves are read on the right axis, unstable curves on the left.
The dimensionless parameter
fz
i
/u
∗
is typically
∼
1 or smaller (with
f
=
10
−
4
s
−
1
,
z
i
0
.
3ms
−
1
=
1000 m, and
u
∗
=
it is 1/3). Under increasingly
convective conditions (i.e., as
z
i
/L
increases) we expect decreasing mean wind
shear, so from
Eqs. (11.5)
we expect decreasing curvature of the stress profiles as
well.
Figures 11.4
and
11.5
nicely illustrate this tendency in Deardorff's (
1972a
)
large-eddy simulations.
Figure 11.6
is an idealized model of stress and mean wind profiles in the
barotropic CBL. We can sketch out its vertical structure using surface-layer
coordinates and the momentum
equations (11.3)
written in the form
−
∂uw
∂z
=
∂vw
∂z
=
f(V
−
V
g
),
f(U
g
−
U).
(11.6)