Geoscience Reference
In-Depth Information
u
u
ave
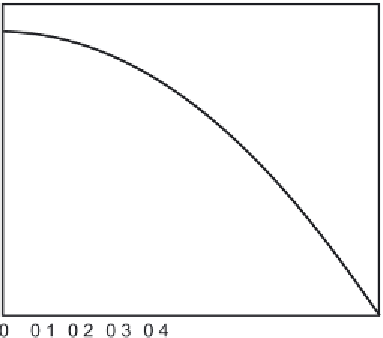
Figure 1.4 Profiles of
u/u
ave
in turbulent pipe flow,
Eq. (1.8)
, “flatten” as the
Reynolds number increases, making the mean shear and mean stress at the wall
much larger than in laminar flow with the same average velocity.
Pipes typically have some wall roughness, and
Figure 1.2
indicates that the mean
wall stress increases with that roughness. The explanation (
Kundu
,
1990
)isthat
immediately adjacent to the wall in
tu
rbulent pipe flow is a
laminar sublayer
of
thickness
δ
(τ
wall
/ρ)
1
/
2
the
friction velocity
. If the typ-
ical height
h
r
of the individual “bumps” or
roughness elements
on the wall is
much less than
δ
, wall roughness has minimal effect and the mean wall stress is
the viscous one given by
Eq. (1.9)
.Butas
h
r
approaches
δ
the roughness ele-
ments cause
form drag
through the pressure distribution on their surface, which
adds to the viscous drag and increases the friction factor
f
.When
h
r
is large
enough this form drag dominates and
f
ceases to change with
Re
, as indicated in
An analogous situation exists for the wall heat flux
H
wall
(watts m
−
2
). It is carried
entirely by the molecular diffusion process called
conduction heat transfer
:
∼
5
ν/u
∗
, with
u
∗
=
r
=
R
k
∂T
∂r
H
wall
=−
,
(1.10)
with
k
the thermal conductivity (watts m
−
1
K
−
1
). The heat flux is continuous at
the fluid-wall interface, but the temperature gradient there is discontinuous if
k
of
the wall material and the fluid differ. We shall consider the fluid side.