Geoscience Reference
In-Depth Information
R
e
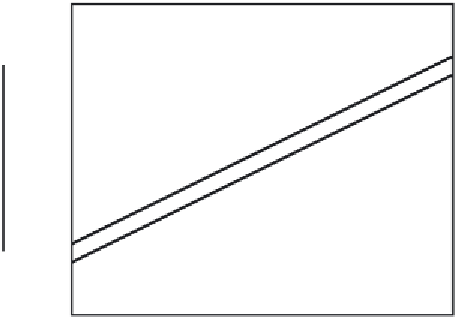
Figure 1.3 The ratios of mean fluxes at the wall in turbulent and laminar flow
through smooth pipes. The momentum-flux ratio is
Eq. (1.7)
evaluated with
f
data from
Figure 1.2
;
the heat-flux ratio is
Eq. (1.16)
evaluated with
Nu
data from
Dittus and Boelter
(
1930
), as summarized by
Turns
(
2006
).
This ratio is plotted for smooth pipes in
Figure 1.3
.
It has very large values at large
Re
, indicating the strong influence of turbulence on the wall stress.
Turns
(
2006
) shows that a good fit to the classical mean-velocity measurements
of
Nikuradse
(
1933
) in turbulent pipe flow is
2
.
5ln
Re f
1
/
2
5
.
5
.
1
f
1
/
2
√
2
u(r)
u
ave
=
r
R
2
√
2
−
+
(1.8)
Figure 1.4
shows that this profile is much “flatter” in the core region than the laminar
profile
(1.1)
.Atlarge
Re
the mean-velocity gradient is significant only adjacent
to the wall, where it is much larger than in laminar flow of the same bulk fluid
velocity. The wall stress in turbulent flow is still defined by the velocity gradient at
the wall,
Eq. (1.3)
, but that gradient, and therefore the wall shear stress, fluctuates
chaotically with time and with position. The mean value (which we designate by
an overbar) of the wall stress is
r
=
R
=−
r
=
R
μ
∂u
∂r
μ
∂u
∂r
τ
wall
=−
.
(1.9)
We have used the property that the differentiation and averaging can be done in
either order
(Problem 1.3)
. The sharp increase in the mean-velocity gradient at the
wall at transition
(Figure 1.4)
causes a sharp increase in wall stress
(Figure 1.2)
.