Environmental Engineering Reference
In-Depth Information
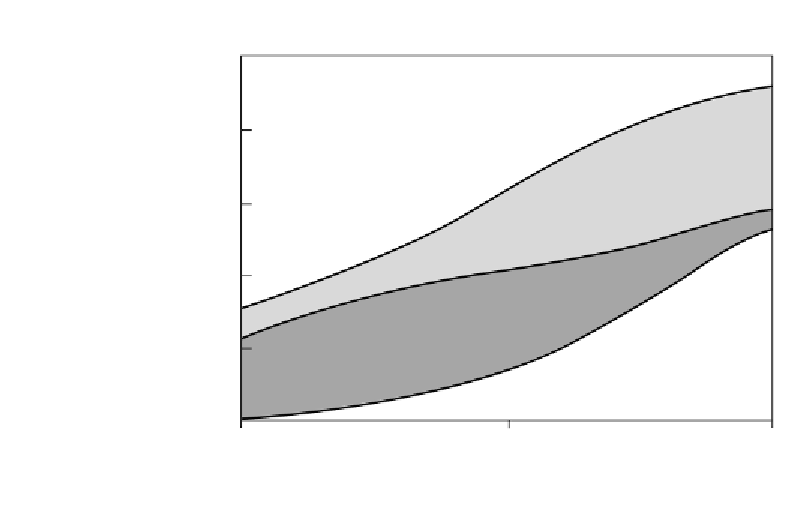
250
200
Coal
150
100
Oil and gas
50
Nuclear
0
1975
2000
2025
FIGURE 1
“Schematic future for US gross primary energy use.” (Rocky Mountain Institute)
comfort, illumination, the ability to bake bread and make steel. If those are
the kinds of services we are after, then we ought to start by asking “How
much energy, of what kind or quality, at what scale, from what source, will
do each desired task in the cheapest way?”
If you ask that question, you get a very different answer, even when
mainly assuming the same economic growth as before (figure 2).You end
up with a stabilizing, and even declining, amount of total energy used as
you wring out the losses in converting, distributing, and especially using it.
So you use less and enjoy it more. At the same time as the depletable fuels
become less available, or less pleasant, I thought they could be gradually dis-
placed by appropriate renewable sources (“soft technologies”), a category
which the Royal Dutch Shell group, planning in 1984, thought might plau-
sibly be providing half the world's energy by 2050, which is a bit off the
right end of the graph in figure 2. Now they say that is highly probable
because the renewables are getting ever cheaper as we make more of them.
A lot of funny things happened along the way.
We subsidized energy very heavily and still do, spending $20 billion-$30
billion a year to make it look cheaper than it really is. Most of the subsidies
go to the least attractive and competitive kinds of energy, which happen to
have the strongest lobbies.The same is true in R&D spending. In the crit-