Environmental Engineering Reference
In-Depth Information
250
200
150
100
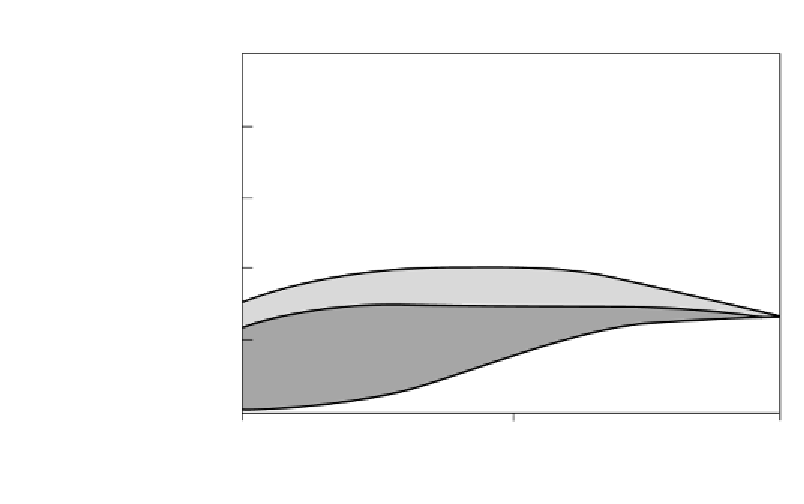
Coal
Oil and gas
50
Soft tech
0
1975
2000
2025
FIGURE 2
“Alternative illustrative future.” (Rocky Mountain Institute)
ical period 1973-1989, for example, this is where our investments in energy
research went, at a federal level, and they bear essentially no relation to
where we got our new energy supply. In fact, from 1979 to 1986 we got
about 4.5 times as much new energy from savings as from all increases in
supply, and slightly over half of those increases in supply were from sun,
wind, water, and wood, the minority from oil, gas, coal, and uranium. Not
too bad for the poor cousins in the investment lottery.
It is kind of fun now to look back on what actually happened.The offi-
cial forecasts of US energy use were all heading toward about 150
quadrillion BTUs per year, and I was very heavily criticized in 1976 for say-
ing they might remain below 100 BTUs. But we have already cut $150 bil-
lion-$200 billion off the nation's annual energy bill by wringing more
work out of the energy we use. Almost all of that happened before 1986,
when efficiency had depressed demand so much that it crashed the price,
which has been going down ever since.Today we have gasoline that is much
cheaper than bottled water and cars that are cheaper per pound than Big
Macs. It is not surprising that we have a whole lot of driving going on.
Since 1986, there has been rather little energy saving in those sectors. In
fact, we have even gone back slightly in “car” efficiency in recent years.
(Many of today's “cars” are juggernauts.)