Database Reference
In-Depth Information
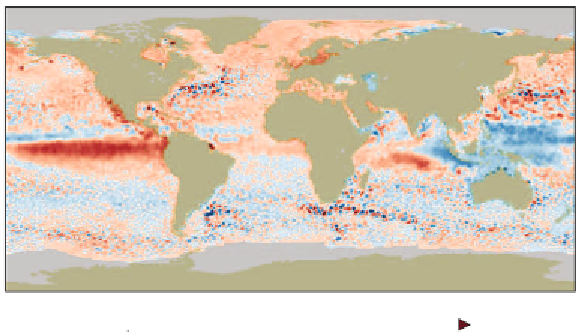
Figure 15.4.
Global sea surface height (SSH) anomaly for the week of October 10
1997 from the Version 3 dataset of the Archiving, Validation, and Interpretation of
Satellite Oceanographic (AVISO) dataset. Eddies can be observed globally as closed
contoured negative (dark blue; for cyclonic) or positive (dark red; for anti-cyclonic)
anomalies. Best seen in color.
to satellite data, ocean surface temperatures and color have been used
to identify ocean eddies based on their signatures on such fields. While,
these fields are impacted by eddy activity, there are additional phenom-
ena that affect them as well effectively complicating eddy identification
in such fields. More recently, sea surface height (SSH) observations from
satellite radar altimeters have emerged as a better-suited alternative for
studying eddy dynamics on a global scale given SSH's intimate connec-
tion to ocean eddy activity. Eddies are generally classified as either
cyclonic if they rotate counter-clockwise (in the Northern Hemisphere)
or anticyclonic otherwise. Cyclonic eddies cause a decrease in SSH and
elevations in subsurface density surfaces. Anti-cyclonic eddies cause an
increase in SSH and depressions in subsurface density surfaces. These
characteristics allow us to identify ocean eddies in SSH satellite data.
In
Figure 15.4
, anti-cyclonic eddies can be seen in patches of positive
(dark red) SSH anomalies, while cyclonic eddies are reflected in closed
contoured negative (dark blue) SSH anomalies.
Eddies can manifest themselves as local minima (maxima) embedded
in a large-scale background of negative (positive) anomalies [13] (see
Figure 15.5
). Given the large variations in SSH at a global scale, track-
ing eddies globally presents several characteristic challenges. First, SSH
data is prone to noise and uncertainty, making it dicult for meaning-
ful eddy patterns to be distinguished from spurious events and noise.